Vermillion Insights
February 22, 2026 · Ken Vermeille · 16 min read
How to Calculate Customer Retention Rate for Your SaaS
Learn how to calculate customer retention rate with real-world examples. This guide breaks down the formula and shows you how to use it for SaaS growth.

Here's the formula to calculate customer retention rate: take the number of customers you have at the end of a period, subtract the new customers you picked up during that time, divide that by the number of customers you started with, and then multiply by 100.
This simple calculation tells you how many of your existing customers you successfully kept over a set timeframe. It's one of the clearest measures of loyalty you can track.
Why Customer Retention Is Your Real Growth Engine

Before we jump into spreadsheets and formulas, it's critical to understand why this metric is so important, especially for founders. Customer retention isn’t just a historical number to stick in a board deck; it’s a live signal of your product-market fit and the absolute bedrock of sustainable growth.
Too many startups get caught in the "leaky bucket" trap, prioritizing acquisition above everything else. While bringing in new users is obviously essential, keeping the ones you already have is far more profitable.
In fact, a mere 5% increase in customer retention can boost profitability by a staggering 25% to 95%. This isn't magic. It happens because loyal customers cost less to serve, they tend to spend more over time, and they become your best marketers through word-of-mouth.
The True Indicator of Business Health
Investors and potential acquirers obsess over retention because it cuts through the noise and reveals the underlying health of a business. A high retention rate is proof that your product delivers real, ongoing value.
It's a predictive tool that signals:
- Strong Product-Market Fit: People are sticking around because your app actually solves their problem, day in and day out.
- Predictable Revenue Streams: High retention makes your future revenue more stable and much easier to forecast.
- A Healthy User Experience: It’s a reflection of a smooth journey, from first use to daily engagement. Recognizing this means implementing effective customer onboarding best practices.
A high retention rate tells investors you’ve built something people truly need, not just something you were able to sell once. It’s the difference between a fleeting trend and a durable business.
Ultimately, this metric is about more than just loyalty - it's about efficiency and long-term viability. When you know how to calculate customer retention rate, you unlock a powerful lens for viewing your company’s future.
For a deeper look at the other side of this coin, you might find our guide on what churn rate means for your SaaS business useful.
The Core Formula: Getting Your Numbers Straight
Let's get right to it. Calculating your customer retention rate isn't some dark art; it's about a single, powerful formula that tells you exactly how loyal your customers are. It cuts through the noise.
For a business like Vermillion, where our success is built on keeping partners happy month after month, this isn't just a metric - it's the heartbeat of the company.
The formula itself is refreshingly simple:
Retention Rate = ((Customers at End of Period - New Customers During Period) / Customers at Start of Period) × 100
Practical Example:
Let's imagine you run a project management SaaS. You're calculating retention for Q2 (April 1st to June 30th).
- You started Q2 with 500 paying customers (S).
- During Q2, your marketing efforts brought in 75 new customers (N).
- By the end of June, your dashboard shows 520 total paying customers (E).
Now, let's plug these numbers into the formula:
((520 - 75) / 500) × 100
= (445 / 500) × 100
= 0.89 × 100
= 89%
Actionable Insight: Your Q2 customer retention rate is 89%. This means you successfully kept 89% of the customers you started the quarter with. While 89% is a strong number, it also tells you that 11% (55 customers) churned. Your next step is to investigate why those 55 customers left. Was it a competitor's new offer? A pricing change? A feature they needed that you don't have? This single metric gives you a clear starting point for your investigation.
To see how that number stacks up, you can check out some helpful industry retention averages.
Defining Your Variables (The Right Way)
The formula is only as good as the numbers you feed it. To get this right, you’ll need to pull three specific data points from your CRM or analytics dashboard.
Here’s a quick breakdown of what each part of the formula really means and where you can find it.
Customer Retention Rate Formula Breakdown
| Variable | Stands For | What It Means | Where to Find It |
|---|---|---|---|
| E | Customers at the End | The total number of active customers you had on the very last day of your chosen period (e.g., end of the month, quarter, or year). | Your CRM, analytics platform, or billing system. |
| N | New Customers Acquired | The total count of brand-new customers you signed up *during* that same period. These are first-timers only. | Marketing analytics, CRM reports on new sign-ups, or sales data. |
| S | Customers at the Start | The total number of active customers you had on the very first day of the period. This is your starting baseline. | Your CRM, analytics platform, or billing system. |
It's absolutely critical that you subtract the new customers (N). Why? Because we're trying to figure out how many of your existing customers stuck around. Lumping new acquisitions in there would muddy the waters and give you a false sense of security.
The single biggest mistake I see founders make is not clearly defining what an "active customer" actually is for their app. Get this wrong, and your retention rate becomes a vanity metric. Get it right, and it becomes your north star.
What Counts as an “Active Customer” for You?
Before you pull a single number, you have to set a ground rule: what makes someone an "active customer"? If you don't define this clearly, your retention rate will be totally unreliable from one month to the next.
Is it someone who logs in? Someone with a paid subscription? Someone who uses a specific feature?
The answer depends entirely on your business model. Here are a few real-world examples:
- For a SaaS app: An active customer is likely any user with a paid, non-delinquent subscription.
- For a mobile game: It might be any user who opened the app at least once in the last 30 days.
- For an e-commerce store: It could be a customer who made at least one purchase in the last quarter.
Once you set this rule, stick to it. Consistency is everything. It’s what allows you to spot genuine trends over time and turn your retention rate from a simple number into a powerful indicator of your app's health.
Applying the Formula to Different Business Models
The basic customer retention formula is a great starting point, but it's just that - a start. A single, blended rate for your entire business doesn't tell you much. It's like looking at a car's dashboard and only seeing the total miles driven, with no speedometer or fuel gauge.
To get real, actionable insights, you have to adapt the formula to your specific business model. The way you track a B2B SaaS subscriber is fundamentally different from how you measure the loyalty of a one-time mobile app purchaser. Breaking it down this way turns a simple number into a powerful diagnostic tool, showing you exactly where you're winning and where users are dropping off.
Scenario 1: B2B SaaS Cohort Analysis
For any subscription business, cohort analysis is non-negotiable. Forget looking at a single, company-wide retention number. It’s a vanity metric that hides the truth.
Instead, you need to group users by the month they signed up (e.g., the "January 2024 cohort") and track that specific group's behavior over time. This approach immediately shows you if your product changes, new features, or onboarding improvements are actually working.
Let's walk through a real-world example. Imagine a B2B SaaS app that rolled out a major onboarding redesign in February.
- January Cohort (Pre-Redesign):
- Started with: 100 new customers in January.
- Month 1 (End of Feb): 80 of the original 100 are still active. Retention = 80%.
- Month 2 (End of Mar): 65 of the original 100 remain. Retention = 65%.
- Month 3 (End of Apr): Only 55 are left. Retention = 55%.
Now, let's look at the group that experienced the new onboarding flow.
- February Cohort (Post-Redesign):
- Started with: 120 new customers in February.
- Month 1 (End of Mar): 108 of the original 120 stick around. Retention = 90%.
- Month 2 (End of Apr): 90 of the original 120 are still active. Retention = 75%.
Actionable Insight: The results are night and day. The February cohort shows a 10-point jump in first-month retention, and that lift carries into the second month. This is a crystal-clear, data-backed signal that the new onboarding is working. It's delivering value faster and plugging a leaky bucket. The job isn't done, though. The next step is to figure out why the other 25% still churned.
This diagram breaks down the fundamental logic behind these calculations.
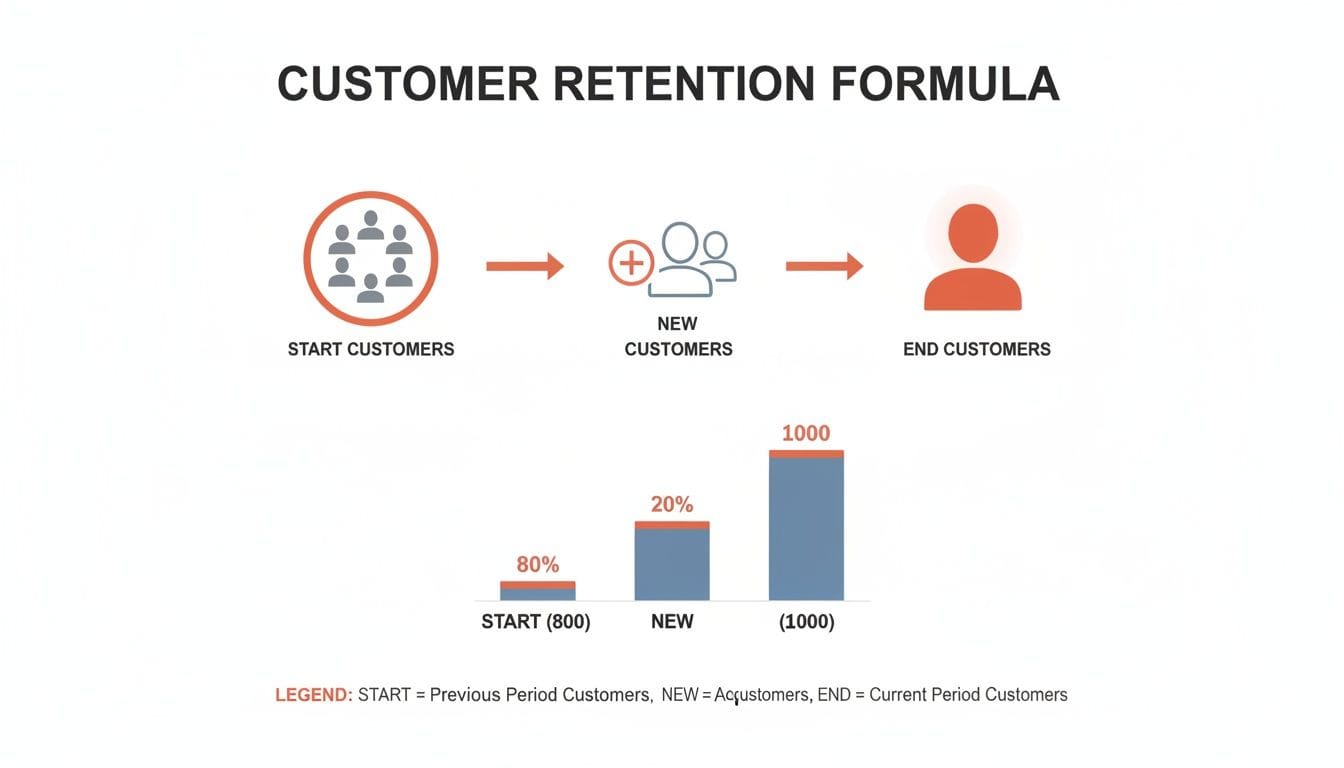
Whether you're looking at monthly subscribers or annual contracts, the flow is the same: you start with a base, account for new customers, and see who is left at the end. That simple path is the foundation for every retention calculation you'll do.
Scenario 2: One-Time Purchase Models
But what if you don't run on subscriptions? Maybe you sell a paid mobile app, a one-off course, or physical products. You can’t track monthly retention in the same way, but you can measure something just as powerful: your repeat purchase rate.
This metric tells you how many of your customers liked their first experience enough to come back for a second. It's the ultimate vote of confidence for a non-subscription business.
Let’s say you run an e-commerce store selling niche camera gear. You want to see how many of your Q1 customers came back to buy something else in Q2.
- Total unique customers in Q1: 500
- Unique customers from that Q1 group who bought again in Q2: 75
The formula here is refreshingly simple:
(Number of Return Customers / Total Number of Customers) x 100
Plugging in our numbers: (75 / 500) x 100 gives us a repeat purchase rate of 15%.
For an e-commerce business, a 15% repeat purchase rate is a solid signal. It means you've built a core group of fans who see real value in what you offer - a strong indicator of product-market fit and customer satisfaction.
Actionable Insight: A 15% rate is good, but it also shines a spotlight on a massive opportunity: 85% of your customers were one-and-done. This single number should immediately trigger strategic questions. Are you sending post-purchase follow-up emails? Do you have a loyalty program? Is there a clear next step for a first-time buyer? This metric gives you a clear mandate: build a system to turn first-time buyers into repeat customers.
Turning Your Retention Rate into Actionable Insights
So you've calculated your customer retention rate. That’s the first step. But the number itself - say, 89% - is meaningless in a vacuum. Is that good? Is it bad? Honestly, it depends entirely on your industry, your business model, and who you’re selling to. An 89% retention rate could be cause for a massive celebration or a serious red flag.
The real power isn't in the number itself, but in turning that number into a road map.
A single, blended retention rate for your entire user base often hides the most important stories your data is trying to tell you. It’s like checking the weather for an entire country instead of your specific city. To find insights you can actually use, you have to break it down.
Segment Your Data to Uncover Opportunities
This is where you go from a vanity metric to a genuine diagnostic tool. Segmentation is just a fancy word for slicing your customer base into smaller, more meaningful groups. Instead of one broad retention number, you can calculate separate rates for different segments to see who is really sticking around and who is walking out the door.
Practical Example:
A productivity app calculates an overall monthly retention of 90%. Good, but not insightful. They decide to segment by pricing tier:
- Free Plan Users: 75% retention.
- Pro Plan ($10/mo) Users: 92% retention.
- Business Plan ($50/mo) Users: 98% retention.
Actionable Insight: This immediately reveals that their highest-value customers are the stickiest. The big leak is in the free plan. This insight prompts several actions:
- Survey Churned Free Users: Find out what value they were missing.
- Improve Onboarding for Free Users: Guide them to the "aha!" moment faster.
- Focus Marketing on Business Users: Since they retain so well, double down on acquiring more customers like them.
Start by looking at your data through these lenses:
- Acquisition Channel: Are customers from paid ads churning faster than those from organic search? You might discover your partner program delivers users with a 25% higher retention rate. That’s a crystal-clear signal on where to double down.
- Pricing Tier: Do your enterprise customers have a much higher retention rate than your self-serve or free-tier users? This can tell you if your product’s core value resonates more strongly with a specific market segment.
- Customer Cohorts: How does the retention of customers who signed up in March compare to those who joined in April? This is absolutely essential for measuring the impact of new feature releases or changes to your onboarding flow. You can learn more about this powerful technique in our detailed guide to cohort analysis.
A number is just a number until you compare it to something. Benchmarking against your own historical data and industry averages tells you whether you're leading the pack or falling behind.
Benchmarking Against the Industry
In the cutthroat world of software scaling - where a partner like Vermillion hardens performance for bootstrapped founders - understanding benchmarks is how you find leverage.
For SaaS products, Pendo's 2025 global data shows average user retention is 39% after one month, dropping to just 30% by month three. Here’s the critical part: the top 10% of performers retain 1.7x more users in that first month. That shows just how wide the gap between "average" and "great" can be. Explore more data on user retention rate benchmarks to see how you stack up.
The Connection to Churn Rate
Finally, always look at retention alongside its inverse: customer churn rate.
They are two sides of the same coin. While retention measures the percentage of customers you keep, churn measures the percentage you lose. Looking at both gives you the complete picture of customer loyalty.
If your retention rate for a specific segment is 70%, your churn rate for that same group is 30%. Analyzing both helps you understand the full story. A high retention rate shows you what's working and where to invest more. A high churn rate points directly to problems you need to fix - whether it’s a flaw in your product, a gap in your support, or a fundamental mismatch in customer expectations.
The Common Traps That Wreck Your Retention Math
Calculating customer retention seems straightforward, but I’ve seen teams get it wrong time and time again. Tiny, innocent-looking errors can quietly inflate your numbers, masking real problems until it’s way too late.
Think of this as a quick sanity check for your data. Getting this right is foundational. If your inputs are garbage, the decisions you make based on those outputs will inevitably steer you in the wrong direction - you’ll end up investing in the wrong features or completely missing the friction points that are bleeding you dry.
Mixing Up New and Existing Customers
This is, without a doubt, the single most common pitfall. The whole point of the retention formula is to see how many of your existing customers - the ones you started the month with - stuck around. Tossing new sign-ups into that final count will always make your retention look rosier than it is.
- Don't Do This: You start with 100 users, gain 50 new ones, and end the month with 120. Calculating
(120 / 100)gives you 120% retention. This number is not only wrong, it’s meaningless. - Do This Instead: Use the correct formula:
((120 - 50) / 100) x 100 = 70%. This number is real. It tells you that you actually held onto 70 of your original 100 customers, and now you have something actionable to work with.
A flawed calculation is worse than no calculation at all. It gives you a false sense of security while your business quietly springs leaks. It’s the classic "garbage in, garbage out" problem.
Using Mismatched Timeframes
Another frequent mistake is comparing retention rates across inconsistent time periods. It’s an apples-to-oranges comparison that can cause a whole lot of unnecessary panic or, just as bad, misplaced celebration.
For example, looking at December's retention (often inflated by holiday slowdowns in churn) right next to January's (when people are notorious for re-evaluating subscriptions) is completely misleading. Seasonality is a real thing, and it impacts user behavior in just about every industry I can think of.
To get a true picture of your growth trajectory, you have to compare like with like:
- Month-over-Month: Great for tracking progress on short-term initiatives and campaigns.
- Quarter-over-Quarter: Helps smooth out some of the monthly noise and gives you a broader trend line.
- Year-over-Year: This is the gold standard for accounting for seasonality. You’re comparing January 2024 to January 2023, which gives you a much more honest assessment of growth.
A Fuzzy Definition of an "Active User"
Finally, if your team doesn't have a rock-solid, agreed-upon definition of an "active user," your retention metric is basically built on quicksand. The numbers will shift depending on who pulls the report, making the metric completely unreliable.
You need a definition that is clear, documented, and applied consistently every single time.
- Bad Definition: "Someone who uses the app." What does "uses" even mean?
- Good Definition: "A user with a paid subscription who has logged in at least once in the last 30 days."
This level of specificity is non-negotiable. It ensures that every time you sit down to figure out how to calculate customer retention rate, you're measuring the exact same thing. This is what turns retention from a flimsy vanity metric into a vital health indicator for your entire business.
How Retention Directly Impacts MRR and LTV

Knowing how to calculate your retention rate is step one. But the real magic happens when you connect that number directly to your bottom line - specifically, your Monthly Recurring Revenue (MRR) and Customer Lifetime Value (LTV).
Retention isn't just a "nice-to-have" health metric; it's a powerful financial lever.
Even a tiny improvement creates a compounding effect that can dramatically boost your revenue. It turns your MRR from a flat line into an upward-curving growth engine. Why? Because retained customers don't just stick around. They often upgrade, expand their usage, and become more profitable the longer they stay with you.
This is where the math gets really exciting. A seemingly small 5% increase in customer retention can boost company profitability by a staggering 25-95%. That's because loyal customers not only spend more, but they also cost far less to serve than acquiring new ones.
Connecting Retention to LTV
Your retention rate is one of the most critical variables in your LTV formula. While you can build some seriously complex models, the relationship is actually pretty simple at its core.
A straightforward way to see it is:
LTV = Average Revenue Per Account (ARPA) / Customer Churn Rate
Since your churn rate is just the inverse of your retention rate (a 95% retention rate means a 5% churn rate), you can immediately see how even small tweaks to retention have an outsized impact on LTV.
Let's look at a quick example:
- Scenario A: Your ARPA is $100/month and your retention is 90% (which means a 10% monthly churn).
- LTV = $100 / 0.10 = $1,000
- Scenario B: You manage to improve retention to 95% (dropping churn to 5%).
- LTV = $100 / 0.05 = $2,000
Actionable Insight: By boosting retention by just five percentage points, you literally doubled the lifetime value of every single customer. This means you now have double the budget to acquire a new customer and still be profitable. That one change gives you a massive competitive advantage and unlocks new growth channels that were previously too expensive. For a deeper look at this, check out our full guide on how to calculate LTV.
When you focus on retention, you aren't just stopping customers from leaving. You are fundamentally increasing the underlying asset value of your entire business. Each percentage point gained in retention directly translates to a more valuable, predictable, and scalable company.
The Bigger Financial Picture
This direct link between retention, LTV, and MRR is why it’s a non-negotiable metric for any app founder. To really build a sustainable business, you have to understand the balance between customer acquisition retention.
Ultimately, focusing on keeping the customers you’ve already earned is one of the highest-impact activities you can undertake. It’s the difference between constantly trying to refill a leaky bucket and building a reservoir of predictable, long-term revenue.
Got Questions About Customer Retention?
Once you start digging into customer retention, a few questions always seem to pop up. Let's clear up some of the most common ones I hear from founders.
What’s a “Good” Customer Retention Rate for a SaaS Company?
Everyone wants a magic number, but the real answer is: it depends. That said, for most SaaS businesses, aiming for an annual retention rate of 90% or higher is a solid goal.
The real benchmarks, though, are all about who you sell to.
If you’re a B2B SaaS serving big enterprise clients, the bar is much higher - think closer to 95%. These customers are stickier and the cost of losing one is massive. On the other hand, if you're building a B2C app or focusing on small businesses, a rate between 80-90% is often considered strong.
The most important thing isn't hitting some universal number. It's benchmarking against companies like yours and, more importantly, seeing your own numbers improve month after month.
How Often Should I Be Calculating Retention?
For most software companies I work with, a dual-cadence approach works best: track it monthly and quarterly. This gives you the best of both worlds.
- Monthly checks are your early warning system. They let you see the immediate impact of your actions - like how that new feature launch or onboarding tweak affected churn. It’s all about short-term trends.
- Quarterly and annual views give you the big picture. They smooth out the noise from any single weird month and provide a much more stable indicator of your company's long-term health.
Can My Retention Rate Go Over 100%?
No, your customer retention rate itself can't top 100%. The math is simple: you can't keep more customers than you started with.
But - and this is a big but - a closely related metric, Net Revenue Retention (NRR), absolutely can and should go over 100%.
This happens when the extra revenue you get from your existing customers (think upgrades, expansion seats, or add-ons) is more than the revenue you lost from the customers who churned. An NRR above 100% is one of the most powerful signs of a healthy, growing SaaS business. It means your product is so valuable that your existing customer base is growing on its own, even before you add new logos.
At Vermillion, we help founders move beyond just calculating metrics to building the kind of product that drives them. We build the technical foundation that supports growth, ensuring your app can scale as your retention - and revenue - climbs. See how we do it at https://vermillion.agency.
Keep reading
See all →
March 22, 2026
Unlocking Revenue Your Guide to Price Tier Strategy

March 21, 2026
Your Guide to Flawless Stripe Subscription Management

May 14, 2026
Fractional Mobile Engineering vs. Full-Time Hiring in 2026
The mobile engineering talent market has shifted dramatically over the past two years. Budgets are tighter, AI tools have changed what a sin...

March 20, 2026
Recurring Billing With Stripe a Guide for Subscription Apps
Master recurring billing with Stripe. This guide covers everything from setup and server logic to webhooks and churn reduction for subscript...

March 19, 2026
Unlocking Growth with Mobile App Retention Metrics
Discover the mobile app retention metrics that directly fuel MRR growth. This founder's guide offers actionable strategies to track, analyze...