Profitability of Apps: How to Make Your App Business Thrive
Let's be blunt: yes, building an app can be wildly profitable. But only for the tiny fraction who get the economics right from the start. Success isn't about stumbling upon a great idea or getting lucky; it's about a deep, rigorous understanding of your financial model from day one. The profitability of apps is built on strategy, not chance.
Is Building an App Still a Profitable Venture?

It’s easy to get swept up in the dream of creating the next billion-dollar app. We all see the headlines. And while it’s true that global mobile app revenue has rocketed past $935 billion, the reality on the ground is a brutal fight for survival. The app market is a classic power-law game—a handful of apps gobble up nearly all the profits, leaving scraps for everyone else.
This guide is your playbook for breaking into that profitable elite. We'll dig into why the massive app market is also a minefield and how a strategic, data-obsessed approach is your only way through. It’s time to shift your thinking from just building a cool product to building a real, sustainable business.
Moving Beyond Vanity Metrics
Downloads, daily active users, and five-star reviews feel incredible. They look great in a pitch deck. But they don't pay your developers or keep the servers running. These are "vanity metrics" for a reason—they stroke the ego but often mask a broken business model.
True profitability lives in the numbers that track the actual flow of money.
Imagine two fitness apps:
- App A boasts 1 million downloads but only 0.5% of users pay for its $5 monthly subscription.
- App B has a more modest 100,000 downloads, but a solid 10% convert to its $10 monthly subscription.
App A looks way more popular on the surface, right? But do the math. App B is pulling in $100,000 a month, while App A is only making $25,000. That’s the critical difference between popularity and profitability.
Actionable Insight: Instead of just tracking download numbers, start tracking your "download-to-trial" and "trial-to-paid" conversion rates. This simple shift forces you to focus on users who show real purchase intent, giving you a much clearer picture of your financial health.
The Sobering Reality of App Success
Here’s the hard truth: most apps are financial failures. While the exact numbers are debated, the consensus is that a tiny percentage—often cited as less than 1%—achieve any significant financial return.
This isn't to scare you off, but to ground your strategy in reality. The founders who win are the ones who know the odds are stacked against them and prepare accordingly. You can learn from the missteps of others by understanding why more than 99% of apps fail and how to sidestep those common traps.
Success demands a relentless focus on your app's economic engine from the very beginning. Throughout this guide, we'll break down the metrics, monetization models, and cost structures you absolutely must master.
The Core Metrics That Define App Profitability
To really get a handle on your app's financial health, you need to speak the language of app finance. It's a world filled with acronyms, but these aren't just buzzwords—they're the vital signs of your business. Mastering them is non-negotiable if you want to build an app that actually makes money, not just one that racks up downloads.
Forget vanity metrics for a second. Let's get into the real numbers that investors obsess over and successful founders live and die by. These metrics tell you if your economic engine is actually working, or if you're just building a very popular, very expensive hobby.
Lifetime Value (LTV): The North Star Metric
Lifetime Value (LTV) is probably the single most important number you'll ever track. It represents the total amount of money you can realistically expect to make from a single user over their entire time with your app. Simply put, LTV tells you what a customer is actually worth to you.
Practical Example: A meditation app offers a $69.99/year subscription. On average, a paying user sticks around for 18 months (1.5 years).
- *LTV = $69.99 1.5 = $104.98**
- This single number tells the founder they can afford to spend up to $104.98 to acquire a new subscriber and still break even.
A key piece of this puzzle is the SaaS Customer Lifetime Value calculation, which is essential for predicting that long-term revenue.
Customer Acquisition Cost (CAC): The Price of Growth
While LTV tells you what a user is worth, Customer Acquisition Cost (CAC) tells you what you paid to get them in the door. This isn't just your ad spend; it's all your sales and marketing costs—from Facebook campaigns to your content team's salaries—divided by the number of new customers you brought in during that period.
Actionable Insight: Don't just calculate a blended CAC for your entire business. Break it down by channel. You might discover your Instagram ads cost $50 per customer, while your blog content only costs $10 per customer. This insight allows you to shift your budget to the most profitable channels immediately.
The LTV to CAC Ratio: The Ultimate Health Check
This is where the magic happens. The LTV to CAC ratio is the clearest, most direct indicator of whether your app has a viable business model. It answers the one question that matters: Are you spending more to get a customer than they will ever pay you?
- LTV/CAC < 1: Red alert. You are actively losing money on every single new user.
- LTV/CAC = 1: You're breaking even on acquisition, which leaves zero margin for anything else—like paying your team or keeping the lights on.
- LTV/CAC > 3: This is the gold standard. A 3:1 ratio means for every dollar you spend bringing in a customer, you get three dollars back. That signals a healthy, scalable business.
A strong LTV to CAC ratio is the definitive proof that your business model works. It shifts the conversation from "how many downloads did we get?" to "how much profitable growth can we pour fuel on?"
For a deeper dive, check out our complete guide on the customer lifetime value calculation formula to make sure you're getting this critical number right.
Tracking Predictable Income and User Value
Beyond the LTV and CAC relationship, a few other metrics give you a more granular view of your app's financial pulse. They help you watch your progress month over month and spot opportunities to tighten things up.
- Monthly Recurring Revenue (MRR): For any subscription app, MRR is your lifeblood. It’s the predictable income you can count on every single month, making it the foundation for forecasting and measuring your growth trajectory.
- Average Revenue Per User (ARPU): This metric tells you, on average, how much money you're making from each active user over a specific time. Just divide your total revenue by your number of users. It’s a clean benchmark for how well you're actually monetizing your audience.
- Churn Rate: This is the silent killer of growth. Churn is the percentage of users who cancel their subscription or just stop using your app in a given period. A seemingly low monthly churn of 5% can wipe out more than half your customers in a year, putting you on a treadmill where you have to run faster and faster just to stay in the same place.
The app market is a massive profit engine, generating over $935 billion in revenue, but the winnings are heavily concentrated at the top. Data shows that only about 0.5% of consumer apps are truly successful, and less than 1% earn significant money. These metrics are what separate the winners from the rest, turning a good idea into a great business. You can find more insights from these comprehensive app statistics.
Choosing Your App Monetization Strategy
How your app actually makes money isn't just a business decision; it's a core feature of the product itself. Get it right, and it feels like a natural part of the experience. Get it wrong, and you'll alienate users and kneecap even the most brilliant app idea before it gets off the ground.
This isn't an afterthought. It's something you need to bake into your app's DNA from day one.
Let's break down the four main ways apps generate revenue. Each has its own user psychology and financial quirks, and picking the right one is one of the most important calls you'll make.
At its core, the entire game comes down to a simple, brutal equation: the money you get from a user over their lifetime (LTV) has to be more than what you paid to get them in the door (CAC). Your monetization model is the engine that drives the LTV side of this equation.
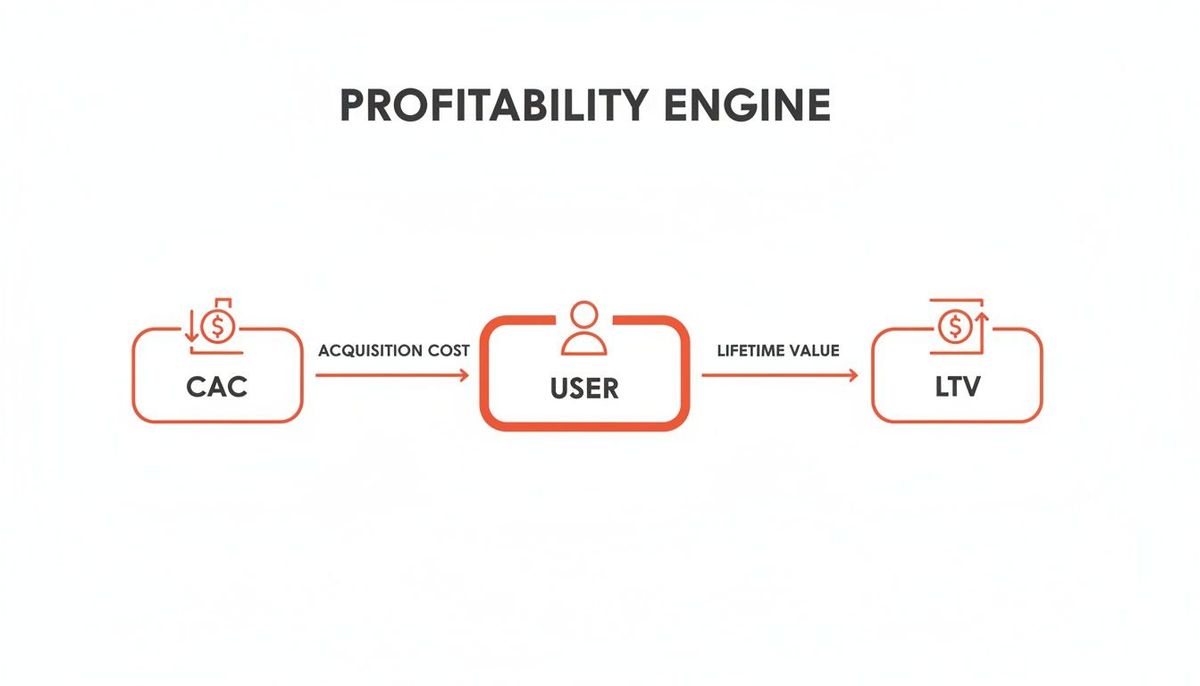
If this engine isn't working, nothing else matters. Your monetization strategy is what fuels it, making sure every user you acquire eventually puts more back into the business than they cost.
The Power of Subscriptions
For many founders and investors, subscriptions are the holy grail. Why? Predictable, recurring revenue. It smooths out cash flow, makes forecasting easier, and gives your business a stable foundation to grow on.
This model is a perfect fit for apps that deliver ongoing, evolving value. Think content libraries, productivity tools, or services that become a part of a user's daily or weekly routine.
Practical Example: Calm
Calm masters the "freemium" subscription model. They let users access a few free meditations, which is just enough to demonstrate the app's value and help users build a habit. To unlock the full library of content, users must subscribe.
- Actionable Insight: Don't lock away your core value entirely. Give users a meaningful taste of the premium experience for free. This builds trust and makes the decision to upgrade much easier because they already know they love the product.
Another great example is Duolingo. Learning a language is free and fun, but serious learners will happily pay to kill the ads and get advanced features. The free product builds a massive user base, and the subscription monetizes the most dedicated segment.
Driving Revenue with In-App Purchases
In-app purchases (IAPs) are all about one-time transactions for digital goods or premium features. This is the go-to model for apps where users want to enhance their experience, get ahead faster, or unlock a specific piece of functionality.
Revenue can be spiky. Unlike the steady drip of subscriptions, IAPs often rely on a small group of "whales"—high-spending users who drive a huge percentage of the revenue.
Practical Example: Bumble
Dating apps like Bumble have this down to a science. Users can buy "SuperSwipes" to show strong interest or "Spotlights" to boost their profile's visibility for 30 minutes.
- Actionable Insight: Tie your IAPs directly to the user's core motivation. Bumble's purchases succeed because they offer a direct, immediate path to achieving the user's goal: getting more matches. The value proposition is crystal clear.
The opportunity here is massive. Global IAP revenue recently cleared $40 billion in a single quarter, and non-gaming apps are seeing spending jump by 24% year-over-year. People are more willing than ever to pay for digital value.
Leveraging In-App Advertising
If you're building an app with a huge potential user base but a low willingness to pay—think utilities, hyper-casual games, or news aggregators—advertising can be your path to profitability. The entire game is about balancing revenue with user experience. Get too aggressive, and you'll drive people away.
Practical Example: Rewarded Video Ads
Many mobile games offer players a choice: "Watch a 30-second ad to get an extra life." This is a powerful, non-intrusive format.
- Actionable Insight: Frame ads as a value exchange, not an interruption. By giving the user something tangible (in-game currency, an extra try, a premium feature for 24 hours) in return for their attention, the ad feels like a fair trade rather than an annoyance. This dramatically improves user sentiment and engagement.
Capturing Value Through Marketplace Fees
Does your app connect two different types of users to conduct business? If so, taking a cut of the transaction is the most natural way to make money. This is the model that powers giants like Airbnb, Uber Eats, and Upwork.
These platforms don't create the product being sold. They create a trusted, efficient marketplace and charge a commission for making the connection and facilitating the payment.
Practical Example: Upwork
Upwork connects freelancers with clients. For every project completed, Upwork takes a service fee from the freelancer's earnings.
- Actionable Insight: Your fee structure should align with the value you create. Upwork uses a sliding scale fee that decreases as a freelancer earns more from a single client. This incentivizes long-term relationships on the platform, which increases user retention and lifetime value for Upwork itself.
Comparison of App Monetization Models
To help you decide, here’s a quick breakdown of how these four models stack up against each other. Each has clear trade-offs between predictability, how hard it is to get a user to pay, and the type of app it suits best.
| Model | Best For | Revenue Predictability | User Friction |
|---|---|---|---|
| **Subscriptions** | Apps with ongoing value (content, services) | High | Medium |
| **In-App Purchases** | Games, dating apps, productivity tools | Low to Medium | Low to High |
| **Advertising** | Apps with high user volume (utilities, games) | Medium | Medium |
| **Marketplace Fees** | Platforms connecting buyers and sellers | High (at scale) | Low |
Ultimately, the best model feels like a seamless extension of your app's purpose. It should align with why users open your app in the first place and feel like a fair exchange of value. Choosing the right one is a strategic decision that shapes not just your revenue, but your entire product roadmap and user relationship.
To go even deeper, check out our complete guide on the best app monetization strategies.
Understanding Your App's True Cost Structure

It's easy to get excited about revenue. But profit is what actually builds a business. If you want to grasp the real profitability of apps, you have to look past that initial development invoice and face the ongoing expenses that quietly drain your bank account.
I've seen too many promising apps fail not because of a bad product, but because their founders completely underestimated the true cost of just keeping the lights on.
That first build is a one-time capital expense to get you to launch. The real test is managing the operational costs—the recurring bills that grow right alongside your user base. These are the numbers that decide if your business is actually sustainable.
Beyond the Initial Build Costs
Thinking your costs end once the app hits the store is a critical mistake. In reality, your financial journey is just beginning. These ongoing expenses aren't optional extras; they're the essential services and infrastructure that let your app function, grow, and make money in the first place.
Let's break down the most common—and most crucial—recurring costs you need to have on your radar.
- Infrastructure and Hosting: This is the digital real estate your app lives on. Services like Amazon Web Services (AWS) or Google Firebase provide the servers, databases, and file storage your app needs to run. As more people sign up, send messages, or upload photos, these costs will scale directly with that activity.
- Third-Party API Fees: Apps today are rarely built in a vacuum. They plug into specialized services to handle things like payments, messaging, or analytics. And every single one of those services takes a cut, chipping away at your revenue.
- Team Salaries: Your people are your biggest asset and, almost always, your largest expense. This bucket includes developers for maintenance and new features, support staff helping users, and marketers driving growth.
A Practical Example: A Social App's Scaling Costs
Let's walk through the costs for a hypothetical social app, "ConnectSphere." We'll see how its monthly bills evolve as it grows from a bare-bones MVP to a platform serving 100,000 active users.
Actionable Insight: Treat your cost structure not as a burden, but as a series of levers you can pull. If your AWS bill is getting too high, could you optimize how you store images? If API fees are a problem, is there a cheaper alternative or a way to reduce your call volume? Active cost management is key.
Phase 1: The Lean MVP (1,000 Users)
At this stage, your only goal is validation, not massive scale. Costs are kept to the absolute minimum.
- Hosting (Firebase): You're probably still on a generous free tier. Cost: $0 - $25/month.
- Third-Party APIs: You're using Stripe for a few premium features (2.9% + 30¢ per transaction) and maybe RevenueCat for subscriptions on a free plan. Cost: ~$50/month.
- Marketing & Team: It's just you and the co-founders doing organic outreach. Cost: ~$0.
- Total Monthly Cost: ~$75
Phase 2: Early Growth (10,000 Users)
You've got some traction. Users are more active, and you need more robust infrastructure and a real marketing push to keep the momentum going.
- Hosting (AWS): You've graduated to a scalable AWS setup. Cost: ~$400/month.
- Third-Party APIs: Transaction volume is up, and you've likely upgraded your RevenueCat plan. Cost: ~$600/month.
- Marketing: You're now spending money on paid user acquisition to accelerate growth. Cost: ~$2,000/month.
- Team: You've brought on a part-time contractor to help out. Cost: ~$3,000/month.
- Total Monthly Cost: ~$6,000
Phase 3: Scaling Up (100,000 Users)
Your app is now a real business with serious operational demands. This is where the numbers get big.
- Hosting (AWS): With heavy traffic and lots of data storage, your server bill has ballooned. Cost: ~$3,500/month.
- Third-Party APIs: Payment processing and subscription management fees are now a major line item on your P&L. Cost: ~$5,000/month.
- Marketing: That user acquisition budget is critical for maintaining your growth trajectory. Cost: ~$15,000/month.
- Team: You now have two full-time developers and a community manager on payroll. Cost: ~$25,000/month.
- Total Monthly Cost: ~$48,500
As you can see, costs don't just grow—they completely transform. What starts as a tiny server fee becomes a complex budget item that needs careful management. Having this kind of realistic financial blueprint is essential if you want to chart a viable path to profitability.
Alright, let's ditch the theory and get our hands dirty with some numbers. Building a financial model is the single best way to prove your app is a real business—not just to investors, but more importantly, to yourself. This isn't about becoming an accountant overnight. It's about telling a simple, believable story with your numbers.
We'll start with the big picture: a basic Profit & Loss (P&L) statement. Think of it as your app's monthly report card. It just adds up all the money coming in and subtracts all the money going out.
Then, we'll zoom in on the most critical part of the whole exercise: your unit economics. This is where you prove the entire business model works on a per-user level. It answers the one question that truly matters: "Does each new customer I bring in make me more money than they cost to get?"
Building a Simple P&L Statement
A P&L for an app shouldn’t feel intimidating. At its heart, it’s just Revenue - Costs = Profit (or Loss). Let's walk through a one-month P&L for a fictional subscription fitness app, "FitFuture," that just hit 10,000 active users.
1. Figuring Out Revenue
First, let's count the money coming through the door. FitFuture has one subscription plan at $9.99/month.
- Total Active Users: 10,000
- Conversion Rate to Paid: 5% of users subscribe (a pretty standard starting point)
- Paid Subscribers: 10,000 users × 5% = 500 subscribers
- Monthly Revenue: 500 subscribers × $9.99/month = $4,995
2. Tallying Up the Costs
Next, we subtract all the expenses we covered in the last section.
- Hosting & Infrastructure (AWS): ~$400
- Third-Party Fees (Stripe, RevenueCat): ~$600
- Marketing & Ads: ~$2,000
- Salaries (2 founders): ~$8,000 (a lean startup salary)
- Total Monthly Costs: $11,000
3. The Bottom Line
Now for the moment of truth.
- Net Profit/Loss: $4,995 (Revenue) - $11,000 (Costs) = -$6,005
In this snapshot, FitFuture is losing about $6,000 a month. That might look scary, but it's completely normal for an early-stage app that’s focused on growth. This is exactly why unit economics are so vital—they show you the path out of the red.
Proving Your Unit Economics Work
A negative P&L is perfectly fine if your unit economics are solid. This is the analysis investors live and die by because it proves you aren't just lighting money on fire to acquire users who will never pay you back. It shows that, with scale, your business is designed to be a profit machine.
Let's run the numbers for FitFuture.
Calculating Customer Acquisition Cost (CAC)
Your CAC is simply your total marketing spend divided by the number of new customers you got for that money.
- Monthly Marketing Spend: $2,000
- New Subscribers Acquired: Let's say that spend brought in 200 new paying users.
- CAC: $2,000 / 200 = $10 per customer
Calculating Lifetime Value (LTV)
LTV predicts how much a customer is worth to you over their entire time as a subscriber. For a subscription app, a simple formula is (ARPU) / (Monthly Churn Rate).
- ARPU (Average Revenue Per User): $9.99
- Monthly Churn Rate: Let's assume a healthy 4% of subscribers cancel each month.
- LTV: $9.99 / 0.04 = $249.75
Now, we put it all together.
The LTV to CAC Ratio: $249.75 / $10 = ~25:1
This ratio is fantastic. While the company is losing money on the P&L, the underlying business is incredibly healthy. Every customer they acquire for $10 is projected to generate nearly $250 in revenue. With unit economics like these, the founders have a powerful story to tell investors. They can confidently ask for capital to pour fuel on their user acquisition fire, knowing that growth will lead directly to profit.
While ads often dominate app monetization talks—it's a massive market that generated almost $307 billion recently—direct user spending tells a fascinating story. For example, Apple's App Store consistently brings in more consumer spending than Google Play. In a recent period, it saw gross revenues of $21.5 billion compared to Google Play's $12.1 billion, largely because iOS users tend to spend nearly twice as much on premium apps and subscriptions. You can dig into more of these app monetization trends on Statista.com. This kind of modeling helps you see which platform might be a goldmine for your specific strategy.
Actionable Steps to Maximize App Profitability

Knowing the theory is one thing, but putting it into practice is what actually builds a business. Let’s boil everything down into a practical toolkit. These are the concrete moves you can make at every stage to drive the profitability of apps, from the back of a napkin to a scalable product.
Pre-Launch Foundation
Before a single line of code gets written, your entire focus needs to be on financial validation. Getting this part right is what stops you from building an app that people love but that can never, ever make money.
- Validate Your Monetization Model: Don’t just choose a model—put it to the test. Planning a subscription? Create a simple landing page describing your app's features and present two pricing tiers: "$9.99/mo" and "$14.99/mo". Use an "Notify Me at Launch" button to see which price point convinces more people to sign up with their email. This simple test gives you real data on price sensitivity before you've spent a dollar on development.
- Build Your First Unit Economic Forecast: Fire up a simple spreadsheet and model out your LTV and CAC. You won't have real numbers yet, so use industry benchmarks to make educated guesses. For a meditation app, you might pencil in a $5 CAC from Instagram ads and an LTV of $60 from a 12-month subscription. Right away, you can see a healthy 12:1 ratio on paper, which is a great starting point.
Launch and Initial Testing
The second your app hits the store, your job shifts from forecasting to fact-finding. This is where your beautiful spreadsheet assumptions collide with real-world user behavior. You have to be ready to adapt, and fast.
Your initial launch isn't the finish line; it's the starting line for optimization. The goal is to replace your assumptions with hard data as fast as possible, using early users to show you the true path to profitability.
Make sure your analytics are wired up before you launch. You can't fix what you can't see.
Post-Launch Growth and Optimization
Okay, now you have real users and real revenue data trickling in. This is where the real work begins: the endless, iterative cycle of optimization. Tiny tweaks at this stage can have a massive impact on your bottom line over time. You're no longer building the engine; you're fine-tuning it for performance.
- Optimize User Onboarding: Your number one goal is to crush early churn by showing users the "aha!" moment instantly. A budgeting app, for instance, might see a 15% drop in first-week churn just by pushing new users to link one bank account in the first 60 seconds. It's all about demonstrating value, immediately.
- A/B Test Your Paywalls: Never, ever assume your paywall is perfect. Constantly experiment with pricing, messaging, and design. A fitness app could pit a "Yearly Plan - 70% Off" button against a "Most Popular - $59.99/year" button. A small change in wording can easily lift conversion by 5-10%, which directly pumps up your LTV.
- Introduce Complementary Services: What else can you offer that adds value and opens up a new revenue stream? A project management app could roll out a premium add-on for "Time Tracking" or "Advanced Reporting." This lets you scale revenue from your most loyal customers without having to pour more money into marketing.
Your App Profitability Questions, Answered
When you're building an app, the financial questions can feel just as complex as the code. Let's cut through the noise and get straight to what founders really ask about making money with their apps.
How Much Revenue Does an Average App Make?
Frankly, "average" is the wrong way to think about it. The app market is a game of extremes. The top 200 apps are pulling in over $80,000 a day, while the vast majority—more than 90% of apps—are free and make next to nothing.
Success isn't about just being on the app store; it’s about having a killer, validated monetization strategy from day one. Real profitability comes from business savvy, not just a high download count.
What Is a Good LTV to CAC Ratio?
The magic number here is 3:1. For every dollar you spend to get a customer (CAC), you want them to generate at least three dollars for you over their lifetime (LTV).
Anything below 3:1 is a red flag. A 1:1 ratio means you’re basically lighting money on fire once you factor in operating costs. But a ratio well north of 3:1? That’s the signal of a highly profitable, scalable business that investors absolutely love to see.
Which Monetization Model Is the Most Profitable?
There's no single winner—it all comes down to your app's purpose and who's using it. The right model has to feel natural to your users.
- Subscriptions are gold for content or service-based apps like Spotify. They create predictable, recurring revenue that you can build a business on.
- In-App Purchases work wonders for gaming or dating apps. Be warned, though: you’re often relying on a small handful of big spenders to carry the weight.
- Advertising is a solid choice for high-traffic utility apps. It's often the easiest to implement but usually brings in the lowest revenue per user.
To truly get a handle on how different platforms and user behaviors drive your bottom line, using dedicated monitoring tools for apps is a smart move. You can't optimize what you can't see.
At Vermillion, we don't just build apps; we build revenue-ready app businesses designed to prove traction and deliver ROI, fast. Our performance-based model means we only win when you do. Learn how we turn great ideas into profitable ventures.