A Founder's Guide on How to Measure Product Market Fit

To figure out if you've really got something, you need to listen to what your users are saying (qualitative feedback) and watch what they're actually doing (quantitative data). The classic gut check is the Sean Ellis test—if more than 40% of your users say they’d be "very disappointed" without your app, you're onto something. Pair that with a hard look at your retention cohorts. For example, if your January user cohort shows a 10% retention rate after 3 months, and your February cohort shows 15%, you're making tangible progress towards delivering real, long-term value.
Why Product Market Fit Is Everything
Product-Market Fit (PMF) isn't just another startup buzzword. It’s that make-or-break point where you've built something that a specific group of people truly needs—and they’re willing to use it, stick with it, and ideally, pay for it. For a deeper look at the concept, check out this excellent overview of Product Market Fit (PMF). Honestly, getting this right isn't just a milestone; it's the single most important factor for survival.
The numbers don't lie. When you look at why startups fail, a shocking 34% of them die because they never found product-market fit. That’s the single biggest reason, blowing past other killers like weak marketing (22%) or running out of cash (16%). Even the smartest teams with millions in funding can't force a product on a market that doesn't want it.
Distinguishing Real Demand from Early Hype
This is where so many founders get tripped up. It's easy to mistake the initial buzz of a launch for genuine market demand. A flood of sign-ups, some good press, and a spike in downloads feels like a win, but these are often just vanity metrics. Your first users are usually friends, family, and tech enthusiasts who love trying new things—not necessarily people with a painful, recurring problem that only your app can solve.
True PMF looks and feels completely different.
- Organic Growth: People start telling their friends about your app without you asking or paying them to. Actionable Insight: Track your referral sources in analytics. If you see a growing percentage of new users coming from "direct" or "word-of-mouth" channels instead of paid ads, that's a strong PMF signal.
- Inelastic Behavior: Users stick around even when the app is buggy or imperfect. They'll report bugs instead of just churning—a clear sign that the value they're getting outweighs the friction. Practical Example: A user sends a detailed support ticket with a screenshot of a crash, saying, "I really need this feature for my work, please fix this!" That's a user you can't afford to lose.
- Clear Value Perception: When you ask people what they love about your app, their answers are specific, consistent, and they echo your core value proposition. Practical Example: If you built a project management tool and users consistently say, "It's the only app that makes delegating tasks to my team feel effortless," you've nailed your value perception.
"You can always feel product-market fit when it's happening. The customers are buying the product just as fast as you can make it—or usage is growing just as fast as you can add more servers." — Marc Andreessen
The Two Pillars of Measurement
So, how do you actually measure this thing? It comes down to a balanced approach. You have to look at both what users do (the quantitative data) and what they say (the qualitative feedback). Numbers by themselves can be misleading, and emotional feedback without data doesn't scale.
To get the full picture, you need to combine both perspectives. This dual-lens approach is the bedrock of the framework we're about to build in the next sections. If you need more background, our complete guide on what product-market fit is and why it's crucial for your startup offers additional context on this foundational concept.
The Two Pillars of Measuring Product Market Fit
| Measurement Type | Key Questions Answered | Primary Metrics & Methods |
|---|---|---|
| **Qualitative** | "Why do users love or leave us?"<br>"What problem are we *really* solving for them?"<br>"How disappointed would they be if we disappeared?" | • Sean Ellis PMF Survey<br>• Net Promoter Score (NPS)<br>• User Interviews & Feedback Sessions<br>• App Store Reviews |
| **Quantitative** | "Are users coming back?"<br>"How engaged are they?"<br>"Are they converting and staying customers?" | • Retention & Cohort Analysis<br>• Funnel Conversion Rates<br>• MRR, LTV, ARPU<br>• Paid Conversion & Churn |
By weaving these two threads together, you move from guessing to knowing. You get an actionable, 360-degree view of how well your product truly fits the market it serves.
Building Your PMF Measurement Framework
You can't improve what you don't measure. Simple as that. Before you get lost in a sea of analytics, you need a blueprint for what you're trying to prove. A solid PMF measurement framework doesn't start with data; it starts with a sharp, testable hypothesis about your user and the value you deliver.
This forces you to move beyond fuzzy assumptions. You have to get crystal clear about who you’re serving and why they should give a damn.
A strong hypothesis isn't some vague mission statement like "our app helps people eat healthier." It's specific and actionable. Practical Example: "Health-conscious millennials will use our meal planning feature at least three times a week because it saves them significant time."
See the difference? This statement nails down the target user (health-conscious millennials), the core action (using the meal planning feature), the expected frequency (3x/week), and the value prop (saving time).
Once you have a hypothesis this sharp, you can start translating it into actual metrics and KPIs. To get there, it’s also incredibly helpful to start with an understanding social listening and how it can uncover the why behind what your users are doing. It adds the qualitative color to your quantitative data.
From Hypothesis to Trackable Metrics
This is where the rubber meets the road. You need to instrument your app to capture the right data from day one. Using an analytics platform like Amplitude or Mixpanel, you can track specific user actions, which are called events. These events are the building blocks for every piece of quantitative analysis you'll run, from cohort retention charts to conversion funnels.
Let me be blunt: setting up clean, consistent event tracking is non-negotiable. Bad data leads to bad decisions, full stop. Your event naming and the properties you attach to them must be standardized across your team. For our meal-planning app, the hypothesis we defined tells us exactly which events are critical to track.
Key Takeaway: Your PMF measurement framework is only as good as the data it’s built on. Define your core user hypothesis first. Then, instrument your app with clean event tracking that directly measures the behaviors tied to that hypothesis.
This whole process is a loop, not a straight line. You gather feedback, analyze the data, synthesize what you've learned, and then repeat.
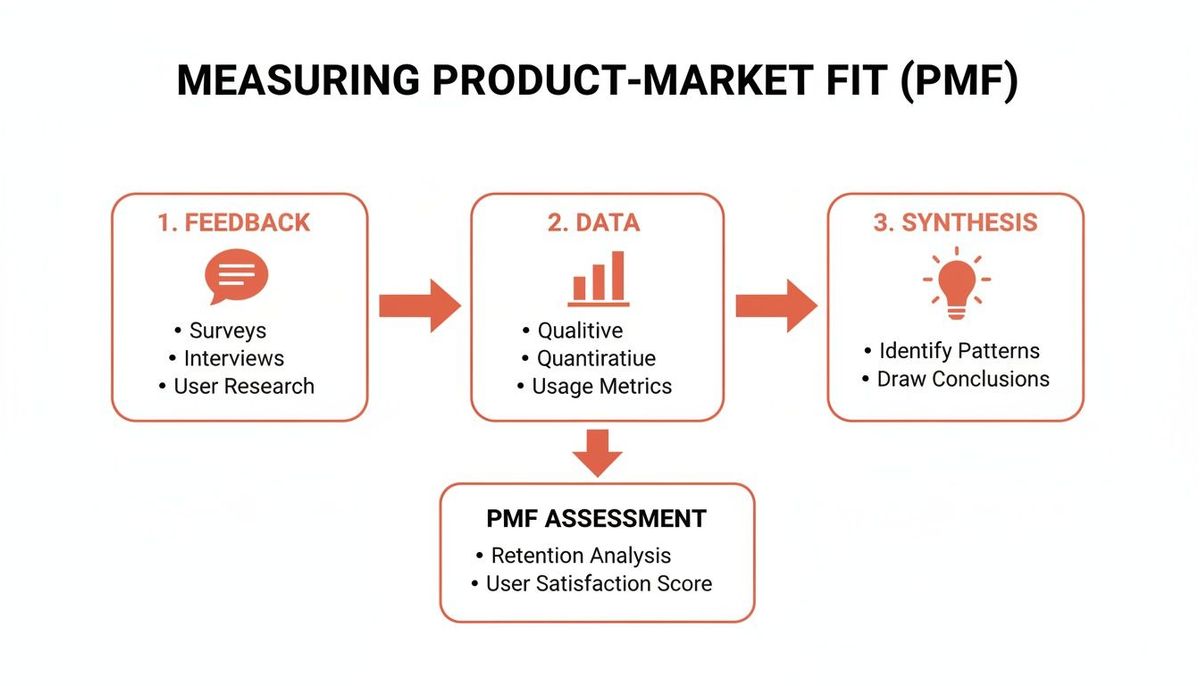
Measuring PMF isn’t a one-and-done task. It’s a continuous cycle of learning and iterating your way toward a product people can't live without.
Critical Events for a Subscription App
For any mobile app running on a subscription model, some events are simply foundational. They map the user journey toward monetization. Tracking these ensures you can measure not just if people are tapping around, but if they're willing to pay—the ultimate test of value.
Here's a starter checklist of the absolute essential events you need to implement:
- `App Installed`: The very first touchpoint.
- `Account Created`: Signals a user has moved past anonymous browsing and is leaning in.
- `Onboarding Completed`: Shows the user has been introduced to the app's core value.
- `Trial Started`: The first real commitment. This user has strong interest.
- `Core Feature Used`: This is your "aha!" moment event. Practical Example: for our meal-planning app, this would be `Meal Plan Created`.
- `Subscription Purchased`: The moment a user converts to a paying customer. This is a huge signal.
- `Subscription Canceled`: A critical event for tracking churn and figuring out why users are leaving.
By instrumenting these events right from the start, you're building a rich dataset that’s ready for the deep analysis we’ll get into next. This setup is the foundational work you have to do to measure PMF accurately and make data-informed decisions that actually drive growth.
Reading the Tea Leaves: Your App's Quantitative PMF Signals
Once you’ve got your measurement framework humming, your user data starts telling a story. This is where you learn to translate raw numbers into a clear, honest assessment of whether you're on the right track to product-market fit. We’re going to zero in on the three quantitative pillars that tell you almost everything you need to know: retention, engagement, and conversion.

These metrics pull you out of the world of "gut feelings" and into reality. They're the hard evidence you need to answer the most important questions about your app's performance.
Retention: The Ultimate Sign of a Sticky Product
If you only look at one metric, make it retention. It’s the single most important quantitative signal for PMF, answering the most basic question: Are people coming back?
If they aren't, nothing else you do will matter. The best way to see this in action is with a cohort retention chart.
Think of a cohort as a graduating class—a group of users who all signed up during the same period, like the first week of February. A retention chart tracks what percentage of that class comes back to your app over the following days, weeks, or months.
You'll always see a steep drop-off at the beginning. That’s perfectly normal. What you’re looking for is the moment the curve stops plummeting and starts to level out. That "flattening curve" means you've found a core group of users who find your app indispensable.
A flattening retention curve is the holy grail of early-stage product analytics. It proves that you've built something that a specific group of users can't live without, forming the bedrock of a sustainable business.
Practical Example: For a social app, a healthy Day 30 retention might be 25%. For a B2B productivity tool, a Month 3 retention of 40% could be fantastic. While benchmarks vary by industry, the shape of that curve is what truly tells the story.
Engagement: Are They Actually Using It?
Okay, so people are coming back. Great. But what are they actually doing?
Engagement metrics tell you if people are getting real value from your product. This is where you need to move past flimsy vanity metrics like total downloads or even Daily Active Users (DAU). We're looking for proof of habit formation.
Here’s what to focus on:
- Core Action Completion: What’s the one thing your app must do for a user to get value? For a meditation app, it's completing a session. For an e-commerce app, it's making a purchase. Track the percentage of users who complete that core action.
- Feature Adoption: Dig into which features your most loyal users are interacting with. This is where you find your product's "magic" and figure out where to double down.
- Session Frequency & Duration: How often are users opening the app, and how long are they staying? For a news app, high frequency is a powerful signal of a daily habit.
Actionable Insight: Let’s say you discover that users who create three projects in their first week have 80% higher retention. Boom. You’ve just found a critical activation moment. Now you can redesign your onboarding to guide every new user toward that exact "aha!" experience.
Tracking these behaviors effectively requires the right tools. Picking from the best analytics tools for mobile apps is a foundational step to gathering clean, actionable engagement data.
Funnel Analysis: Finding the Leaks in Your Bucket
Finally, funnel analysis is your diagnostic tool. It maps out the user journey through a series of key steps, from the first install to a critical conversion event, showing you exactly where people are dropping off.
A typical funnel for a subscription app might look like this:
- Account Created
- Onboarding Completed
- Trial Started
- Subscription Purchased
By measuring the conversion rate between each step, you can pinpoint where your user experience is breaking. Practical Example: If 90% of users create an account but only 30% start a trial, you have a massive leak right after signup. Is your value prop unclear? Is the trial button hidden? Funnel analysis tells you exactly where to start digging for answers.
These three quantitative signals—retention, engagement, and conversion—don't live in isolation. They paint a complete picture. A flat retention curve shows you have a sticky product. Deep engagement proves users are getting value. And healthy funnels show your growth engine is efficient and scalable.
Listening to Your Users: The Story Behind the Numbers
Data tells you what your users are doing, but it will never tell you why. That crucial context—the frustration, the delight, the "aha!" moment—doesn't live in a dashboard. It lives in the minds of your users.
To really get a grip on product-market fit, you have to go beyond the numbers and have actual conversations. This is where qualitative insights turn confusing data points into a clear, actionable story.

It’s this human-centric approach that bridges the gap between behavior and motivation. It’s what you need to build an app people genuinely can't live without.
The Sean Ellis Test: The Gold Standard PMF Survey
If there’s one tool that has become the benchmark for measuring PMF, it's the Sean Ellis Test. It’s a deceptively simple but incredibly powerful way to gauge how attached users are to your product.
The heart of the test is a single, direct question you send to a segment of your most engaged users—think people who have been active for at least two weeks.
“How would you feel if you could no longer use [Your App Name]?”
The real magic is in the multiple-choice answers:
- Very disappointed
- Somewhat disappointed
- Not disappointed
- N/A - I no longer use your product
Sean Ellis, who ran early growth at giants like Dropbox, found a surprisingly reliable benchmark. If more than 40% of your users say they would be "very disappointed," you've likely hit strong product-market fit and have the green light to scale aggressively.
This 40% threshold has become an industry standard because it cuts through vanity metrics and measures genuine dependency. It tells you if your product has become indispensable.
Uncovering Deeper Insights with User Interviews
Surveys give you scale, but one-on-one interviews give you depth. Honestly, just talking directly to your users is the fastest way to understand their world, their pain points, and how your app actually fits into their lives. This isn't a sales pitch; it's a discovery session.
The key is asking open-ended questions that get them telling stories, not just giving yes/no answers.
Practical Tip: Recruiting Users for Interviews Don't overcomplicate this. Send a simple, personal email to a segment of your most active users. Offer a small incentive like a $25 Amazon gift card for 20 minutes of their time. A subject line like, "Feedback on [Your App] + a gift card for you" works wonders.
Once you have them on a call, focus on questions that reveal their journey:
- "Can you walk me through the last time you used our app? What were you trying to get done?"
- "Before you found us, how were you dealing with [the problem your app solves]?"
- "What's the one thing our app does that you find the most value in? Why that specifically?"
- "If you could wave a magic wand and change one thing about the app, what would it be?"
These kinds of questions shift the conversation from features to feelings and workflows. That's where the richest insights are found. Your job is to listen more than you talk and understand their reality, not to defend your product.
Mining for Gold in Your Support Channels
Your most honest and unfiltered feedback is often hiding in plain sight. App store reviews, support tickets, and social media DMs are absolute treasure troves of qualitative data. Users go to these places when they are either extremely happy or extremely frustrated—both are powerful learning opportunities.
Don't just react to these on a case-by-case basis. Systematize it. Create a simple spreadsheet or use a tagging system in your help desk software to categorize feedback into recurring themes.
Actionable Insight: Example Feedback Themes:
- Onboarding Confusion: Are multiple users getting stuck at the exact same step? ("I can't figure out how to add a teammate.")
- Feature Requests: Is there one specific feature that comes up over and over again? ("We desperately need a calendar view.")
- Performance Issues: Are people complaining about crashes on a certain device model? ("The app keeps crashing on my Pixel 6.")
- Pricing Objections: What are users saying about the value they get for the cost? ("$10/month feels steep for just one feature.")
By regularly reviewing and tagging this inbound feedback, you can spot patterns that a small set of user interviews might miss. This creates a continuous stream of qualitative data that keeps you plugged into your user base's evolving needs, helping you iterate your way closer to that undeniable product-market fit.
Monetization Metrics: The Ultimate Test of Value
Let's be honest. While retention curves and glowing user feedback feel great, the single clearest signal of product-market fit is when people open their wallets.
Monetization is where the rubber meets the road. It’s the proof that you’ve built something more than a "nice-to-have." You're solving a problem so painful that your users will pay to make it go away.
Just tracking top-line revenue isn't enough, though. To really know if you have a viable business—not just a popular product—you need to get surgical with a few key financial metrics. This is how you prove not just user love, but business sustainability.
The Lifeblood of Subscription Apps: MRR, ARPU, and LTV
For any subscription app, three metrics are the foundation of your financial health. They tell a story about your growth, how much each user is worth, and whether you're building something that will last.
- Monthly Recurring Revenue (MRR): This is the predictable pulse of your business. It’s the total revenue you generate from all active subscriptions each month. Practical Example: If you have 500 subscribers paying $10/month, your MRR is $5,000. Consistent, compounding growth here is one of the most powerful PMF signals you can have.
- Average Revenue Per User (ARPU): Simply your total revenue divided by your number of users. ARPU tells you what an average user is worth to your business. Actionable Insight: If your ARPU is trending up, it’s a great sign you're either attracting higher-value customers or getting better at upselling.
- Lifetime Value (LTV): This is the big one. LTV projects the total revenue you can expect from a single customer over their entire time using your app. A high LTV means users aren't just paying; they're sticking around for the long haul. That’s the definition of a sticky product.
LTV is the ultimate measure of the value you deliver over time. It combines revenue with retention, giving you a powerful metric to gauge the long-term health of your user base and business model.
Figuring out LTV is absolutely critical. For a deeper look, we have a whole guide on the customer lifetime value calculation formula that will help you master it.
The Golden Ratio: LTV to CAC
Knowing your LTV is only half the picture. You have to stack it up against your Customer Acquisition Cost (CAC)—what you spend in sales and marketing to get a single new customer.
The relationship between these two numbers, your LTV to CAC ratio, is probably the single most important metric for a scalable business.
For a healthy SaaS or subscription company, the industry gold standard is a ratio of 3:1 or higher. Practical Example: If it costs you $100 to acquire a new customer (CAC), you need them to generate at least $300 in total revenue (LTV) for the business to be sustainable.
If your ratio is below 3:1, you’re likely spending too much to acquire customers who don't stick around long enough to be profitable. It’s a massive red flag. It suggests the value users are getting isn't high enough to justify what you're spending to get them—a classic sign of weak product-market fit.
Conversion and Churn: Two Sides of the Same Coin
Finally, two more metrics are essential for measuring the financial health that signals PMF: your conversion rate and your churn rate.
Conversion-to-Paid Rate: This is the percentage of users who move from a free experience (like a trial) to becoming paying customers. A healthy conversion rate, often in the 15-25% range for well-tuned freemium apps, proves your value proposition is strong enough to get people to pull out their credit card.
User Churn: This is the rate at which customers cancel their subscriptions. High churn is a PMF killer. It's like trying to fill a leaky bucket. For early-stage startups, you want to see a monthly churn rate below 5%. This shows that once you've won a customer over, you're good at keeping them.
Common Questions About Measuring Product Market Fit
Even with a solid framework, measuring product-market fit can feel like navigating a fog. It’s full of “what ifs” and tricky scenarios. I’ve seen hundreds of founders and product leaders hit the same walls, so let’s clear up some of the most common questions that pop up on the journey.
Think of this as a field guide to supplement the main framework—quick, real-world answers for situations you're almost guaranteed to face.
How Long Does It Take to Find Product Market Fit
There’s no magic number. I’ve seen it take anywhere from 12 to 24 months for successful startups, but that's just a loose benchmark. The timeline depends entirely on your industry, how complex the product is, and whether your market is a well-trodden path or a brand new one.
The real metric isn't time; it's the speed of your learning cycle. How fast can you run an experiment, get feedback, and adapt the product? That's what matters. The single fastest way to burn through your runway is to chase scale before you've actually validated PMF.
Stop watching the calendar and start watching your metrics. A flattening retention curve, a Sean Ellis score over 40%, a healthy LTV/CAC ratio—these are the milestones that signal you're on the right track. The months are irrelevant if the numbers aren't moving.
Can You Have PMF with a Small Number of Users
Absolutely. In fact, starting small is often better. Product-market fit is about the depth of the value you provide, not the breadth of your user base. It’s about proving you can make a small group of people intensely happy.
Practical Example: If you have 100 users who would chain themselves to your office door if you shut down, you have a far stronger PMF signal than a company with 10,000 users who barely notice the app is on their phone. Your first job is to create fanatics. Once you've delighted that core niche, you can build a strategy to find more people like them.
What Is the Difference Between Problem Solution Fit and Product Market Fit
This is a critical distinction, and getting the order wrong is a classic startup mistake. Think of it as a two-step process.
- Problem-Solution Fit (The Hypothesis): This is the early game. You’ve identified a painful, specific problem for a well-defined group of people. You’ve sketched out a solution that, in theory, fixes it. You’re validating this with user interviews, prototypes, and landing page tests—long before you’ve built a full-scale product. It's about confirming you're building the right thing.
- Product-Market Fit (The Proof): This is the advanced stage. You’ve actually built the solution, launched it, and the market is responding. You have users who stick around, are happy to pay, and tell others. This is proof that your business model works and there's a real, sustainable market for your specific product. It's about confirming you're building it for the right market in a way that can actually grow a business.
What Should I Do If My Metrics Show I Do Not Have PMF
First off, don't panic. This is the default state for almost every new product out there. A lack of PMF isn't a failure; it’s a signal to get back to work.
Actionable Insight: Start digging. Segment your user data like a detective. Is there a tiny pocket of users—maybe from a specific acquisition channel or with a certain demographic—who do show strong retention? If so, you've found your ideal customer profile. Get on the phone with them immediately. Find out what makes your app click for them.
For everyone else who churned, find out why they left. Was the value proposition murky? Did they hit a bug? Was the pricing a turn-off? Combine this feedback with insights from your power users to form sharper, better-informed hypotheses. Then, you test. Tweak your onboarding, A/B test a core feature, adjust your pricing. The road to PMF is just a continuous loop: build, measure, learn. Repeat until the numbers turn in your favor.
Finding and proving product-market fit is the single most important challenge any mobile app will face. It’s a demanding, often frustrating process, but getting it right is the difference between a product that fizzles out and one that becomes indispensable.
If you need a partner who builds apps designed for retention and revenue from day one, Vermillion can help.
Learn how our performance-based model aligns our success with your KPIs.