The Customer Lifetime Value Calculation Formula Startups Need
The simplest way to think about customer lifetime value (CLV) is with a basic formula: CLV = (Average Purchase Value × Purchase Frequency) × Customer Lifespan. This isn't just an accounting metric; it's a powerful tool that tells you how much a single customer is worth to your startup over their entire relationship with you. Getting this right is crucial for long-term survival.
Why Mastering CLV Is a Non-Negotiable for Startup Growth
For any early-stage founder, the daily grind is a balancing act. You're spending money to acquire users today, hoping they generate enough revenue tomorrow. CLV is the metric that brings clarity to that chaos. It turns abstract hope into a strategic weapon.
Think of CLV as your 'customer relationship balance sheet.' It moves beyond a single transaction to reveal the complete financial story of each user. This perspective is vital for making smart, sustainable decisions instead of just chasing short-term wins.
The Strategic Edge of CLV
Understanding CLV isn't just a finance exercise; it’s the foundation of a real growth strategy. It answers the most critical question every founder faces: "How much can I actually afford to spend to get a new customer?" Without knowing what a customer is worth, your marketing budget is a complete shot in the dark.
Customer lifetime value cuts through the noise. It shows you where to focus your efforts by identifying your most valuable customers, spotting upsell opportunities, and flagging churn risks before they blow up.
Let's say you run a subscription box service. You calculate that the average customer will generate $500 over their lifetime. This is your CLV. Now you can make a clear decision about marketing spend. Spending $100 on Facebook ads to acquire a new customer is a sound investment that yields a 5x return. But if you find out your CLV is only $80, that same $100 ad spend is a money-losing proposition, signaling that your business model is fundamentally broken. This simple comparison—the LTV:CAC ratio—is one of the very first things a savvy investor will dig into.
Matching the Formula to Your Stage
Mastering CLV means knowing which formula to use and when. The right way to calculate this metric evolves as your startup matures and you collect more data.
- Early Stage (MVP): A simple, historical formula is perfect. It gives you a quick baseline to see if your model works, without needing tons of data.
- Growth Stage (Scaling): As user data piles up, cohort-based analysis becomes your best friend. It helps you see how product changes actually impact what users are worth over time.
- Mature Stage (Optimization): Predictive models become essential. They allow you to forecast future revenue with much greater accuracy and make proactive decisions.
This guide will demystify each customer lifetime value calculation formula, breaking them down with practical examples. By the end, you'll be able to make smarter calls on marketing spend, feature development, and long-term monetization, turning CLV into the bedrock of your startup's growth.
Using the Simple CLV Formula for Quick Wins
When you're launching a startup, speed is everything. You don't have months to build complex data models; you need answers now. This is exactly why the simple, or historical, customer lifetime value calculation formula is so powerful. It gives you a quick, directional read on the health of your business using data you already have.
The formula itself is refreshingly straightforward. It’s designed to give you a solid baseline for what a customer is worth, fast.
CLV = (Average Purchase Value × Purchase Frequency) × Customer Lifespan
This isn't just some academic exercise. It’s a gut check for your entire business model. When you compare this number to your Customer Acquisition Cost (CAC), you immediately find out if you're building a sustainable company or just burning cash.
Breaking Down the Simple Formula
Each piece of this equation tells a part of your customer's story. Let's break down where you can pull this data, especially if you're a mobile app founder.
- Average Purchase Value (APV): This is just the average amount a customer spends in one go. For a subscription app, this is usually their monthly or annual plan fee. You can pull this number right from your payment processor like Stripe or a tool like RevenueCat.
- Purchase Frequency (F): How often does a customer pay you in a given period? For a monthly subscription, this is simply 12 times a year. For an annual plan, it's 1. Easy.
- Customer Lifespan (L): This is the tricky one for new apps. It's the average time a customer sticks around before they churn. The simplest way to estimate this is by taking the inverse of your churn rate (1 / Churn Rate). If your monthly churn is 5%, your average customer lifespan is 20 months (1 / 0.05).
If you want to go a bit deeper on the strategic side, this guide on the customer lifetime value formula for B2B growth has some great insights.
A Practical Example: A Subscription Wellness App
Theory is great, but let's make this real. Imagine a new wellness app, "Mindful Moments," that sells guided meditation subscriptions.
They've been live for six months and have some early data. Their goal is to get a baseline CLV to figure out their unit economics before they start a major marketing push.
Here’s the data they've collected:
- Average Purchase Value: Most of their users are on the $15/month plan.
- Purchase Frequency: It's a monthly subscription, so that's 12 times per year.
- Customer Lifespan: They're seeing a monthly churn rate of 10%. To get the lifespan in months, they calculate 1 / 0.10 = 10 months. To use this in the yearly formula, they just convert it: 10 / 12 = 0.83 years.
Now, let's plug it all in.
CLV = ($15 × 12) × 0.83
- First, figure out the annual revenue per customer: $15 (APV) × 12 (Frequency) = $180.
- Then, multiply that by their lifespan: $180 (Annual Value) × 0.83 (Lifespan in years) = $149.40.
The simple CLV for a "Mindful Moments" user is $149.40.
Actionable Insight: This single number is incredibly powerful. The founders now have a clear ceiling: they know they can't spend more than $149.40 to acquire a customer if they want to be profitable. More realistically, to maintain a healthy 3:1 LTV:CAC ratio, their target Customer Acquisition Cost (CAC) should be around $50. This hard number guides their marketing budget, informs their ad channel selection, and proves to investors they have a viable business model.
Leveling Up with Cohort-Based CLV Analysis
While the simple CLV formula gives you a vital, big-picture number, it has a major blind spot: it treats all your customers like one big, uniform blob. In reality, they're not. Their behavior, spending habits, and loyalty are all shaped by when they signed up and what your app was like at that moment.
This is where cohort analysis comes in. It gives you a much sharper lens.
A cohort is just a fancy word for a group of users who share a common trait. Most of the time, that trait is when they joined. So, everyone who downloaded your app in January is the "January Cohort." Everyone from February is the "February Cohort." Simple as that.
When you calculate CLV for each cohort, you stop looking at vague averages and start seeing the real story. Did that big feature you shipped in March actually make people stick around longer? Cohort analysis will tell you, clear as day.
Why Cohort Analysis Is a Game-Changer
Relying on a single, company-wide CLV can hide some pretty dangerous trends. Your overall number might look fine, but it could be masking a serious problem. You might have old, high-value users churning out, being replaced by a flood of new users who barely spend anything.
Cohort analysis prevents this by isolating the performance of each group over time. It finally lets you answer the questions that keep you up at night:
- How did our new onboarding flow affect spending for the March cohort compared to the January one?
- Did our price hike in May actually lead to higher CLV, or did it just scare new users away faster?
- Are the users we're getting from that new TikTok campaign more valuable than the ones from our old Facebook ads?
This segmentation turns your customer lifetime value calculation formula from a static number into a dynamic tool for measuring cause and effect.
Practical Example Comparing Two Cohorts
Let's go back to our wellness app, "Mindful Moments." On March 1st, they rolled out a huge update with a totally redesigned onboarding flow and personalized meditation tracks. Now they need to know if all that work actually paid off.
To find out, they'll compare two key groups:
- January Cohort: 1,000 users who signed up with the old onboarding.
- March Cohort: 1,200 users who signed up with the new onboarding.
They track the cumulative Average Revenue Per User (ARPU) for each group over their first four months. To do this right, they need solid data, which is where some of the best analytics tools for mobile apps become indispensable, as they make segmenting users into cohorts a breeze.
Here’s a look at what the data might reveal in a cohort table.
Sample Cohort Analysis for a Mobile App
The table below shows the cumulative ARPU for the two cohorts. Notice how the value for the March cohort starts to pull away from the January cohort over time.
| Cohort | Users | Month 1 ARPU | Month 2 ARPU | Month 3 ARPU | Month 4 ARPU |
|---|---|---|---|---|---|
| **January Cohort (Old Onboarding)** | 1,000 | $15.00 | $22.50 | $28.13 | $31.64 |
| **March Cohort (New Onboarding)** | 1,200 | $15.00 | $25.50 | $35.06 | **$43.13** |
At a glance, the data tells a powerful story. Both groups start with the same $15 subscription fee in their first month. But the March Cohort, the one that got the new onboarding experience, shows much better monetization and retention. The gap just keeps widening.
By Month 4, the average user from the March cohort was worth $43.13—a massive 36% more than the $31.64 value of a user from the January cohort.
Actionable Insight: This isn't just an interesting stat; it's cold, hard proof that the product update worked. The product team now has concrete evidence to double down on personalization features in their roadmap. The marketing team can update their messaging to highlight the new onboarding experience, knowing it leads to more valuable customers. This is the power of cohort analysis: it gives you the clear, segmented insights you need to make confident decisions that pay off again and again.
Future-Proof Your App with Predictive CLV
Looking at historical CLV is a bit like driving while only staring in the rearview mirror. It tells you where you’ve been, but not where you’re going. To really build a sustainable business, you need to look forward. This is exactly where predictive CLV models come in.
Predictive models are your crystal ball. They use what's happening right now with your users to forecast their total future value. This isn't just an academic exercise; it's essential for smart financial planning, winning over investors, and making the kind of strategic bets that define successful apps.
One of the most effective and straightforward predictive formulas relies on just two metrics you should already be tracking.
Predictive CLV = Average Revenue Per User (ARPU) / Churn Rate
The beauty of this customer lifetime value calculation formula is its simplicity. You don't need years of data. It takes a snapshot of your app's current health—how much each user pays and how fast they leave—to project long-term value.
Breaking Down the Predictive Formula
To get this right, you have to nail the two parts of the equation. Each tells a critical story about your user base.
- Average Revenue Per User (ARPU): This is simply the average amount of money you make from one user in a given period, usually a month. It should include everything—subscriptions, one-off purchases, you name it.
- Churn Rate: This is the percentage of users who stop using your app in that same period. Churn is the silent killer of growth, and lowering it is the single most powerful lever you have for boosting CLV.
The magic is in how these two numbers interact. As your churn rate gets closer to zero, your CLV doesn't just grow—it skyrockets. This proves that retention isn't just a "nice-to-have." It’s the engine of your profitability.
Predictive CLV in Action: A Mobile Game
Let's make this real. Imagine you run a mobile game called "Pixel Quest" that makes money from in-app purchases (IAPs) like cosmetic items. You need to figure out your CLV to set a sensible budget for your next big user acquisition campaign.
First, you need to calculate last month's churn rate.
- Users at Start of Month: You started with 10,000 active users.
- Users at End of Month: By the end of the month, only 8,500 of those original users were still around.
- Users Who Churned: That means 1,500 players left (10,000 - 8,500).
- Calculate Monthly Churn: (1,500 Churned / 10,000 Starting Users) = 0.15, or a 15% churn rate.
Next, you calculate your Monthly ARPU.
- Total Monthly Revenue: The game brought in $50,000 from IAPs last month.
- Average Active Users: Over the month, you had an average of 9,250 active users.
- Calculate Monthly ARPU: $50,000 / 9,250 Users = $5.41.
Now you have everything you need for the predictive customer lifetime value calculation formula.
CLV = $5.41 (ARPU) / 0.15 (Churn Rate) = $36.07
Actionable Insight: This single number, $36.07, changes everything. The "Pixel Quest" team now knows that, on average, every new user they acquire is projected to generate about $36. This becomes the North Star for their marketing budget. They can confidently set their target Cost Per Install (CPI) for ad campaigns at $12 to maintain a healthy 3:1 LTV:CAC ratio. If a specific ad channel is costing them $20 per user, they know to cut it immediately. This predictive insight allows for proactive, data-driven budget management instead of reactive spending. To sharpen these forecasts, digging into AI-powered churn rate analysis can add a whole new layer of accuracy to your models.
Choosing the Right CLV Formula for Your Startup Stage
Picking the right customer lifetime value calculation formula is like choosing a map for a road trip.
When you're just starting out, a simple napkin sketch is all you need to make sure you're heading in the right direction. But as you start scaling and moving faster, you need a detailed GPS with real-time traffic data to make smart decisions. Using a complex, predictive model when you barely have users is overkill—like using a satellite phone to find the nearest coffee shop. On the flip side, sticking with a simple formula when you're scaling is like using a paper map on the highway; you’re missing crucial, real-time data.
The key is to match the tool to the job at hand. Your goal is to get the most accurate, actionable insights for your current stage without getting bogged down in complexity. As your startup grows and your data gets richer, your CLV model should evolve with you.
Matching the Model to Your Mission
Each CLV model answers a different strategic question.
The simple formula quickly tells you if you have a viable business model at all. Cohort analysis shows you which product changes are actually making users stick around and spend more. And predictive models? They help you forecast future revenue and make smarter bets on big growth initiatives.
This decision tree gives you a clear path for choosing the right approach based on where you are today.
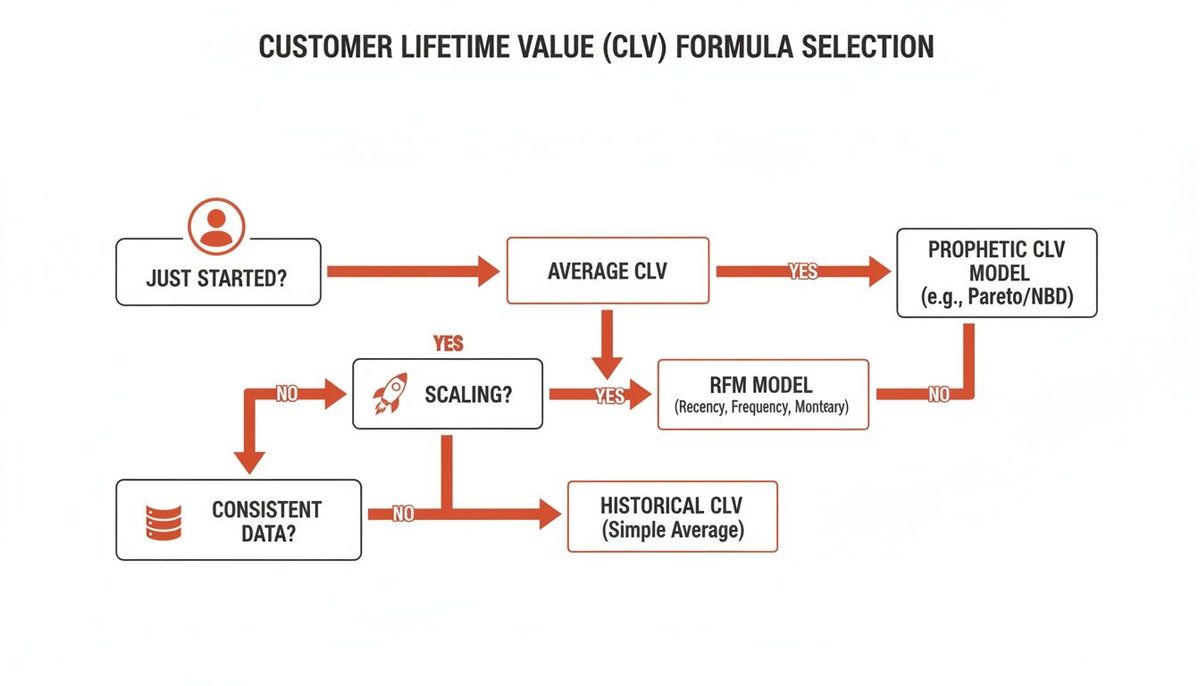
As the visual guide shows, early-stage startups should start simple. As you gather more user data and start to scale, you'll naturally progress to cohort and predictive methods to get deeper insights.
A Practical Comparison of CLV Models
To make the decision even clearer, here's a quick breakdown of the three main models across the factors every founder cares about: data needs, complexity, accuracy, and what it actually helps you do.
Comparison of CLV Calculation Models
| Model | Best For | Pros | Cons |
|---|---|---|---|
| **Simple CLV** | Pre-seed/Seed stage startups needing a quick baseline **LTV:CAC ratio** to prove viability. | Dead simple to calculate with minimal data. Gives you a fast, directional gut check on your business model. | Can be dangerously misleading. It averages everyone together, hiding crucial trends and high-value user segments. |
| **Cohort-Based CLV** | Growth-stage startups testing product changes, new features, or marketing campaigns. | Clearly shows the impact of your actions on user value over time. It's the best way to prove what’s working. | Requires clean, organized historical data. It takes a bit more analytical effort to set up and track properly. |
| **Predictive CLV** | Scaling startups (Series A and beyond) focused on financial forecasting and long-term planning. | Extremely accurate for businesses with stable, predictable user behavior. Essential for serious budgeting and fundraising. | Relies on consistent churn rates. It can be wildly inaccurate if your user retention is volatile or unpredictable. |
Ultimately, choosing the right formula comes down to the question you're trying to answer.
Are you just trying to prove your idea works? Use the simple formula.
Are you trying to figure out what makes your best users so valuable? Dive into cohort analysis.
Are you trying to plan your next 18 months of growth and spending? A predictive model is what you need.
This staged approach ensures your team focuses its energy where it matters most, driving real growth at every step. Getting CLV right is also the bedrock you need before you can truly figure out how to monetize a mobile app effectively.
How to Actually Increase Your Customer Lifetime Value
Knowing your CLV is like getting a diagnosis from the doctor. Improving it is the cure. Once you’ve nailed down a solid CLV number, the real work begins: making that number bigger.
The best way to do this is to break the formula down into its core parts and tackle them head-on. It really comes down to two levers you can pull: making more money per user (Average Revenue Per User, or ARPU) and keeping them around longer (Customer Lifespan).
Focus on these two things, and you can build a practical playbook that grows your business. This is where the theory stops and the real-world results begin.
Increase Average Revenue Per User (ARPU)
Boosting ARPU isn't about squeezing every last cent out of your customers. It's about creating more value they are genuinely happy to pay for. Think smarter, not greedier.
- Implement Tiered Subscriptions: This is a classic for a reason. Offer a basic tier to get people in the door, then create "Pro" or "Premium" tiers with exclusive, high-value features that entice your power users to upgrade.
- Introduce Smart Upsells: Timing is everything. Identify those moments in the user journey where a customer is about to hit a wall and could use a little help. If your app offers cloud storage, prompt them with an upgrade right when they’re about to run out of space. You're not just selling; you're solving an immediate problem.
- Offer Exclusive Add-Ons: Unbundle specific features as one-time purchases or small, recurring add-ons. A fitness app could sell a specialized nutrition guide, while a design app might offer a premium font pack. These small wins add up.
Here’s how it plays out: A language-learning app has a base CLV of $120. They roll out a premium "AI Tutor" feature as an add-on for $5/month. Let’s say 20% of their users grab it and stick with it for an average of 10 months. That’s an extra $50 in revenue from that user segment, boosting their CLV by over 40%. This success provides a clear, data-backed mandate to develop more premium AI-driven features for their roadmap.
Extend the Customer Lifespan
The other side of the coin is simple: the longer a customer pays you, the more valuable they become. Extending their lifespan is all about obsessing over their experience and building a real relationship.
Subscription-based apps live and die by this. In major markets, companies that maintain a CLV to CAC ratio of over 3:1 have been shown to grow revenue 52% faster. They get there by pairing smart monetization with relentless retention tactics.
Proven Retention Strategies
To keep users subscribed, you have to give them reasons to stay. This means being proactive, not just trying to win back people who have already decided to leave.
- Personalize the Onboarding Experience: Your first impression is your most important one. You need to guide new users to that "aha!" moment—where they truly get the value of your app—as fast as humanly possible. Tailor the onboarding flow to their goals and what they do in their first session.
- Build a Strong Community: People stay where they feel like they belong. Create a space for users to connect with each other, share tips, and feel like part of something bigger. This could be an in-app forum, a private Discord server, or exclusive online events. A community turns passive users into passionate advocates.
- Offer Proactive Customer Support: Don't wait for the angry email. Use your analytics to spot signs of friction. Is a user repeatedly failing to complete an action? Reach out with a helpful tip or a link to a tutorial. It shows you're paying attention and prevents minor frustration from turning into churn.
By focusing on keeping the customers you have, you directly attack your churn rate. For a deeper dive, check out our guide on how to reduce customer churn and hold onto your most valuable users.
Common Questions (And Straight Answers) About CLV
Once you start digging into Customer Lifetime Value, the same practical questions always pop up. Here are the straight answers to the hurdles I see founders run into the most.
What’s a Good LTV to CAC Ratio?
For mobile and SaaS startups, the magic number is an LTV:CAC ratio of 3:1 or higher.
It’s pretty simple: this means for every $1 you spend to get a customer, you make $3 back over their lifetime. A 1:1 ratio means you’re basically lighting money on fire. But a 3:1 ratio tells investors you’ve built a healthy, profitable machine. Hit 4:1 or higher, and you’re in an elite territory of efficiency.
Actionable Insight: If your LTV is $300 and your CAC is $150, your ratio is 2:1. This is a red flag. Your immediate action item is to either find cheaper acquisition channels to lower your CAC or focus on improving your product's retention to increase LTV.
How Often Should I Actually Calculate This?
If you're an early-stage startup, calculate CLV monthly. No exceptions. Things change too fast not to. A new feature, a pricing tweak, or a marketing experiment can swing your numbers, and you need to see that impact immediately.
For more established companies with predictable growth, a quarterly calculation can work for high-level strategy. But you should still be watching the core metrics that feed into it—like churn and average revenue—in real-time.
Pro Tip: Your main CLV calculation might be monthly, but a real-time dashboard tracking churn rate and ARPU is your early warning system. It will tell you if customer value is heading south long before your monthly report confirms it.
Can I Calculate CLV for My Free Users?
Absolutely, but you're calculating their Expected Lifetime Value, not their direct value. Since free users don't pay you, their direct revenue is zero. Their value is in their potential to convert.
Here’s the back-of-the-napkin math: multiply the CLV of a paid user by your free-to-paid conversion rate.
For example, if a paid user is worth $400 and 5% of your free users eventually upgrade, the expected value of signing up a new free user is $20 (*$400 \ 0.05**).
Actionable Insight: This helps you justify marketing spend on acquiring free users. You now know you can afford to spend up to $20 to acquire a new free user and still break even in the long run. This justifies running top-of-funnel content marketing or freemium acquisition campaigns that don't generate immediate revenue.
At Vermillion, we build revenue-ready mobile apps with monetization and analytics baked in from day one. We help you prove traction and maximize CLV by aligning our performance with your success. Learn how we do it.