What Is a Good LTV to CAC Ratio for Sustainable Growth
You've probably heard people throw around the term LTV to CAC ratio. So, what’s a good one? The magic number everyone aims for is 3:1.
Put simply, this means you’re generating three dollars in lifetime value from a customer for every one dollar you spent to get them. Hitting that 3:1 mark is the gold standard—it’s a powerful signal that you’ve built a healthy, scalable business where growth is actually profitable.
Why the LTV to CAC Ratio Is Your Most Important Health Metric

Think of your LTV to CAC ratio as your business's ultimate report card. It boils everything down to one critical question: for every dollar you burn acquiring a customer, how many dollars do they give back over their lifetime? This single number tells you if your entire business model is actually viable.
It’s the metric that investors, founders, and growth leaders obsess over because it cuts right through the noise. High revenue numbers look impressive, but they mean very little if you’re spending more to get each customer than they'll ever be worth. LTV to CAC gives you a brutally honest look at your unit economics and long-term profitability.
What Different Ratios Are Telling You
Your LTV to CAC ratio is a diagnostic tool. A number that's too low points to a leaky bucket, but a number that's sky-high might mean you're leaving growth on the table.
Here's a quick health check on what the numbers mean for your business and what you should do next.
LTV to CAC Ratio Health Check
| LTV to CAC Ratio | What It Means for Your Business | Recommended Action |
|---|---|---|
| **Below 1:1** | You're losing money on every new customer. The business model is fundamentally broken and unsustainable. | **Practical Example:** You spend $100 on ads to get a customer who only pays you $80 over their lifetime. **Action:** Freeze acquisition spend immediately. Re-evaluate your pricing, target audience, and acquisition channels. |
| **Exactly 1:1** | You're just breaking even on acquisition costs. Every dollar you spend comes back, but there's no profit left for operations or reinvestment. | **Practical Example:** Your total marketing cost is $5,000 and you get 100 customers, each with an LTV of $50. You're not making money. **Action:** Focus on improving customer retention and monetization to increase LTV. Explore more efficient acquisition channels. |
| **3:1** | **This is the sweet spot.** You have a healthy, efficient, and scalable business. This is what investors look for. | **Practical Example:** It costs you $50 to acquire a customer who generates $150 in lifetime profit. **Action:** You have a green light to scale. Methodically increase your marketing budget while monitoring the ratio to ensure it holds. |
| **5:1 or Higher** | While this looks great, it likely means you're underinvesting in growth. Your acquisition engine is so efficient you could be growing much faster. | **Practical Example:** Your CAC is only $20 but your LTV is $100. You're only acquiring 500 customers a month. **Action:** Aggressively increase your acquisition spend to 1,000 customers/month. Capture more market share before a competitor does. |
Understanding where you fall on this spectrum is the first step toward making smarter growth decisions.
The LTV to CAC ratio is more than just a metric; it's a strategic compass. It guides decisions on everything from marketing budgets and channel focus to product pricing and customer retention efforts. A healthy ratio proves that you've found a repeatable, profitable way to grow.
The Gold Standard for SaaS and Mobile Apps
For SaaS and subscription-based mobile apps, that 3:1 ratio isn't just a suggestion—it's the benchmark. It proves you’ve built an efficient acquisition engine and a product that keeps customers around long enough to be profitable. This is especially true for Series A startups that need to prove their model has real traction and a clear return on investment.
Anything below 1:1 is a red flag. I've seen companies with a $425 LTV and a $417 CAC, which technically works out to a 1.02:1 ratio. But in reality, they're barely breaking even before factoring in any other operational costs. That's not a business; it's a treadmill.
By understanding these benchmarks, you can set realistic targets and diagnose the health of your customer acquisition funnel. To see how this applies specifically to mobile products, check out our guide on the profitability of apps.
Now, let's get into the weeds of how to calculate this essential metric for your own business.
How to Confidently Calculate LTV and CAC
Before you can start improving your LTV:CAC ratio, you have to be able to trust your numbers. Getting this right isn’t about building some crazy-complex financial model; it’s about having a clear, honest picture of your business.
Let's break down the formulas for Lifetime Value (LTV) and Customer Acquisition Cost (CAC) without the MBA-speak.
Think of LTV as the total profit you'll make from an average customer over their entire relationship with your app. To calculate it, you just need a few key ingredients. CAC, on the other hand, is every single dollar you spend to get one new paying customer. It’s way more than your ad budget—it’s the total cost of your growth machine.
Nailing Your Lifetime Value Calculation
To get a solid LTV number, we need three main components. Let’s pretend we’re running a mobile fitness app with a subscription model to make this tangible.
- Average Revenue Per Account (ARPA): This is just the average monthly revenue you get from a single customer. If your app has one subscription tier at $15/month, your ARPA is $15. Simple.
- Customer Churn Rate: This is the percentage of customers who cancel their subscription each month. A 5% monthly churn rate means you lose 5 out of every 100 subscribers.
- Gross Margin: This is the slice of revenue left after you pay for the direct costs of serving your customer—think payment processing fees or server costs. If those costs eat up 20% of your revenue, your gross margin is 80%.
With those numbers in hand, the LTV formula is pretty straightforward:
(ARPA x Gross Margin) / Churn Rate
For our fitness app example:
( $15 x 0.80 ) / 0.05 = $240 LTV
This means, on average, each new subscriber is worth $240 in gross profit to your business before they eventually churn. Getting this calculation right is the critical first step. You can go much deeper into different LTV models with our detailed guide on the customer lifetime value calculation formula.
Accounting for Every Penny in Your CAC
Calculating CAC accurately requires brutal honesty. A ton of founders make the mistake of only counting ad spend, which dramatically underestimates the true cost and makes their ratio look way better than it is. A real CAC has to include all sales and marketing expenses in a specific period.
Your CAC is the total cost of convincing someone to become a paying customer. If a cost contributes to that goal—whether directly or indirectly—it needs to be in your calculation.
To get an accurate CAC, you just add up all those expenses for a given period (say, one month) and divide by the number of new customers you brought in during that same time.
Total Sales & Marketing Costs / New Customers Acquired = CAC
Here’s a checklist of costs you absolutely must include:
- Advertising Spend: The obvious one—all money spent on platforms like Meta, Google Ads, and TikTok.
- Salaries: The salaries and benefits for your marketing team, sales staff, and any growth-focused roles. Don't forget this one.
- Tool Subscriptions: The monthly cost for your CRM, analytics platforms, email marketing software, and design tools.
- Content & Creative Costs: Any money spent on freelancers, agencies, or content creation.
Let's say in one month our fitness app spent $30,000 on total marketing and sales costs and signed up 500 new subscribers.
$30,000 / 500 = $60 CAC
It costs you $60 to get one new customer. Now you have both sides of the equation. And if you want a shortcut, you can always use a dedicated LTV to CAC calculator to speed things up.
Putting LTV to CAC into Practice with Real-World Examples
Alright, theory is great, but let's get our hands dirty. Knowing the formulas is one thing; plugging in the numbers from a real, live business is where the actual insights pop out. We're going to walk through the math for two common mobile app models to show you exactly how these numbers reveal the health of your business.
At its core, the logic is incredibly simple. You figure out what a customer is worth, subtract what it cost you to get them, and what's left is your profit.
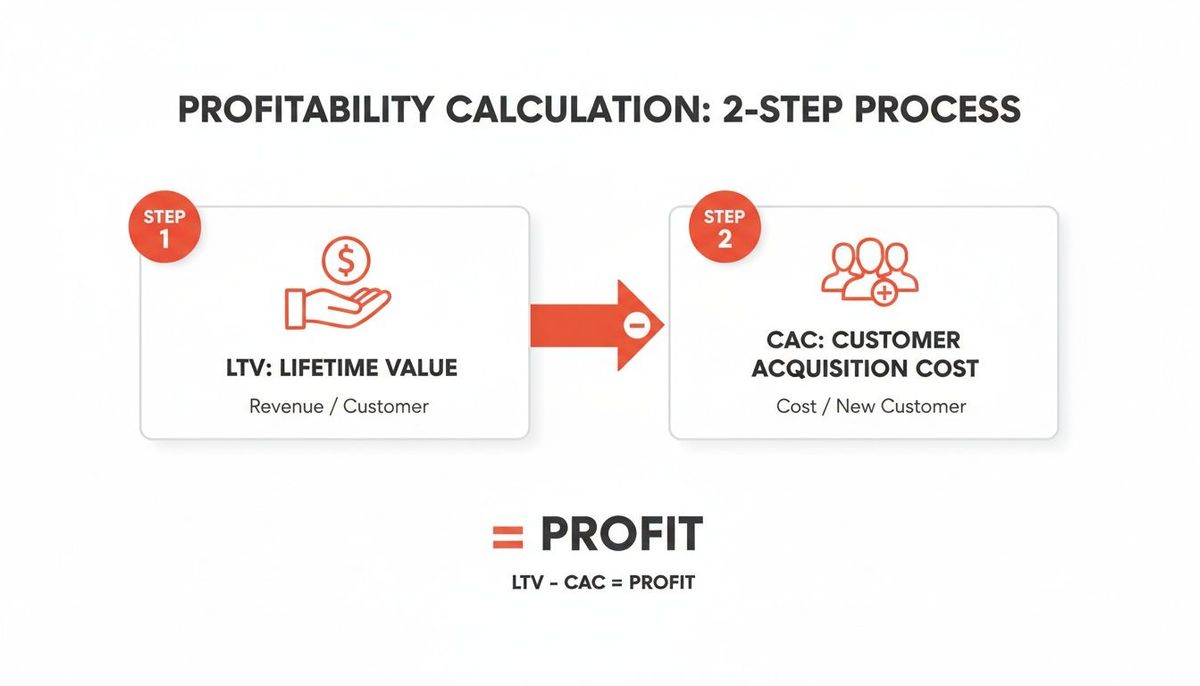
This flow is the foundation of unit economics. Now, let’s apply it to our first example.
Example 1: The Consumer Subscription App
Imagine we've built a meditation app called "ZenZone." It has one subscription plan and gets most of its users from paid social ads. Let's break down its unit economics from the last quarter.
First, we need to nail down the Lifetime Value (LTV).
- Average Revenue Per Account (ARPA): The app's subscription costs $12 per month.
- Gross Margin: After Apple's 15-30% cut and payment processing fees, ZenZone actually keeps 75% of that revenue.
- Monthly Churn Rate: On average, 4% of subscribers cancel each month.
Using the simple LTV formula we covered earlier:
(ARPA x Gross Margin) / Churn Rate = LTV
( $12 x 0.75 ) / 0.04 = $225 LTV
So, every new subscriber we sign up is worth $225 in gross profit over their entire time with us. Solid.
Next up, let's figure out the Customer Acquisition Cost (CAC) for that same quarter.
- Total Ad Spend: $40,000 on Instagram and TikTok campaigns.
- Team Salaries: $20,000 for the two growth marketers running those campaigns.
- Tool Subscriptions: $1,000 for the analytics and marketing automation software they use.
- New Customers Acquired: They brought in 1,000 brand new paying subscribers.
The total cost to acquire those customers was $61,000. A classic mistake here is only counting the ad spend. Forgetting salaries will give you a dangerously optimistic CAC and a false sense of security.
Total Sales & Marketing Costs / New Customers = CAC
$61,000 / 1,000 = $61 CAC
Now for the magic moment. We just divide LTV by CAC.
$225 LTV / $61 CAC = 3.68
ZenZone’s LTV to CAC ratio is 3.68:1. This is a healthy, scalable business. For every dollar they put into the marketing machine, they're getting almost four dollars back. That’s a green light to pour more fuel on the fire.
Example 2: The B2C Marketplace App
Let's switch gears to a different model: "GearUp," a peer-to-peer marketplace where people rent outdoor equipment from each other. Their money comes from taking a cut of each transaction.
Calculating LTV for a marketplace is a bit different. It’s not about a steady subscription; it's about repeat purchases over time.
- Average Transaction Value: The average rental is $50.
- Marketplace Take Rate: GearUp takes a 20% commission, earning them $10 per rental.
- Purchases Per Year: The typical user makes 4 rentals a year.
- Gross Margin: After payment processing fees, their gross margin on that commission is 90%.
- Customer Lifetime: The average user sticks around and stays active for 2.5 years.
Here’s a straightforward LTV calculation for this kind of business:
(Avg. Revenue Per User Per Year x Gross Margin) x Customer Lifetime = LTV
( ($10 take rate x 4 rentals) x 0.90 ) x 2.5 years = $90 LTV
Each new user is worth $90 in gross profit.
Now for GearUp's CAC. They use a mix of Google Ads and a referral program.
- Google Ads Spend: $75,000.
- Referral Program Costs: $15,000 paid out in rental credits.
- Marketing Team Salaries: $30,000.
- New Customers Acquired: They got 3,000 new users to make their first rental.
Total Sales & Marketing Costs / New Customers = CAC
$120,000 / 3,000 = $40 CAC
Finally, let's get the ratio:
$90 LTV / $40 CAC = 2.25
GearUp’s ratio is 2.25:1. This isn't a disaster, but it's not great either. While they're profitable on each customer, the business is hovering below that ideal 3:1 benchmark. This ratio is a clear signal that something needs to change. They either need to increase LTV (maybe by encouraging more frequent rentals or adding a premium membership) or lower their CAC by optimizing their ad spend and referral program.
These two examples show just how critical it is to be honest with your numbers. A half-baked CAC or a miscalculated LTV can lead you to scale a broken model or, conversely, to panic when things are actually on the right track. Getting these calculations right gives you a true, unfiltered view of your business’s potential.
Understanding LTV to CAC Benchmarks by Industry
While the 3:1 ratio is a fantastic rule of thumb, it’s not a universal law. The real answer to “what is a good LTV to CAC ratio?” depends entirely on your industry and business model. Context is everything.
A healthy ratio for a high-margin SaaS business looks completely different from one for a capital-intensive e-commerce brand. Understanding these nuances helps you set realistic goals and shows you how investors will size you up against your direct competitors.
Different industries have unique physics—things like sales cycle length, customer churn rates, and average contract values—that fundamentally change what "good" actually looks like. A business with lower gross margins, for example, simply can't afford the same CAC as a software company with 90% margins.
Let's dive into the specific benchmarks for the most common tech verticals.
B2B SaaS: The Gold Standard
For most B2B SaaS companies, the 3:1 ratio is the definitive benchmark for a healthy, scalable business. This model is built on recurring revenue and high gross margins, which is exactly why investors love it. A 3:1 ratio proves the unit economics are sound and that every dollar you spend on marketing is generating a profitable return.
But what about a ratio of 5:1 or higher? Surprisingly, that isn't always a cause for celebration. While it signals incredible efficiency, it often means the company is underinvesting in growth. In the hyper-competitive SaaS world, a 5:1 ratio can be a signal to step on the gas and capture more market share before a competitor does.
A mature B2B SaaS company might aim for a 4:1 or 5:1 ratio. But for an early-stage startup just trying to prove its model, hitting that 3:1 target is the primary goal. It’s the clearest sign you have a viable business that's ready to scale.
For businesses with long or complex sales cycles, exploring different subscription business model examples can unlock new ways to bump up LTV.
E-commerce and Consumer Apps
The direct-to-consumer world operates on different physics. E-commerce and consumer apps really hit their stride with LTV:CAC ratios between 3:1 and 4:1. This range supports the rapid scaling needed for the marketplaces and social platforms we build at Vermillion, where a low CAC—say, $27-$77—can meet high LTV from repeat purchases.
As Shopify’s benchmarks highlight, a customer with a $300 revenue LTV at a 50% margin nets $150. This makes a 3:1 ratio against a $50 CAC perfectly viable after covering the cost of goods and overhead. This level of efficiency is ideal for Seed to Series A MVPs monetizing through Stripe or Apple IAP, where margins are often tighter.
Marketplaces and FinTech
Marketplace models, like ride-sharing or food delivery apps, often run on razor-thin margins from transaction fees. Because of this, they usually need a higher LTV:CAC ratio to achieve real profitability.
- Marketplaces: These businesses often target a ratio closer to 4:1 or 5:1. Since their take rate on each transaction is small, they depend on massive volume and excellent customer retention to make the numbers work.
- FinTech: This space varies widely. A neo-bank might have a lower ratio at first but enjoy a very long customer lifetime. A trading app, on the other hand, might see higher churn and require a much more efficient acquisition loop. Generally, a 3:1 to 5:1 range is considered healthy, depending on how "sticky" the product is.
Ultimately, knowing your industry's benchmark provides the context you need to accurately assess your own performance. It helps you move from a generic goal to a specific, strategic target that reflects the realities of your market.
Actionable Strategies to Improve Your LTV to CAC Ratio
Knowing your LTV:CAC ratio is like getting a diagnosis from the doctor. Fixing it is the treatment plan. A healthy ratio doesn't happen by accident—it’s the outcome of a deliberate, two-pronged attack. You have to simultaneously increase the value of your customers while systematically driving down the cost to get them.
This balancing act is what separates businesses that just tread water from those that truly scale. The strategies below aren't abstract theories. They are practical, product-led tactics and growth engineering plays you can run to fortify your unit economics.
Let’s break down how to attack both sides of this equation.
Boosting LTV with Product-Led Tactics
Increasing LTV is an inside job. It's about building a better, stickier product that people are willing to pay more for, more often, and for a much longer time. This is where your product and engineering teams can create a massive impact.
1. Nail Your Onboarding Experience
The first few moments a user spends in your app are everything. A clunky or confusing onboarding flow is a recipe for instant churn, killing LTV before it even has a chance. Your only goal should be to get users to their "aha!" moment as fast as humanly possible.
- Actionable Insight: Ditch the generic product tour. If you have a fitness app, ask about their goals (weight loss, muscle gain) during signup. Then, immediately serve up a relevant workout plan on their first session. This shows instant value and skyrockets activation rates.
2. Implement Tiered Pricing Models
A single price point is a guarantee you're leaving money on the table. Tiered pricing lets you capture value from everyone—from the casual user who just needs the basics to the power user who will gladly pay for advanced features. This is a direct lever on your Average Revenue Per Account (ARPA).
- Actionable Insight: A project management tool can offer a "Free" tier, a "$15/month Pro" tier for teams, and a "$49/month Business" tier with advanced reporting. Use in-app prompts to suggest an upgrade when a Pro user tries to access a Business-only feature. This creates a natural, contextual upgrade path.
3. Build Engagement Features to Crush Churn
Churn is the silent killer of LTV. The antidote is building features that make your product an indispensable part of a user's routine. Think about features that create habits and foster a sense of community.
- Actionable Insight: A language-learning app can use a "streak" feature (e.g., Duolingo's flame icon) and push notifications to reward daily practice. Adding leaderboards creates friendly competition, making users far more likely to open the app daily and stick around longer.
Increasing LTV is fundamentally about creating more value. When you solve your customer's problem better than anyone else, they'll reward you with their loyalty and their money.
Slashing CAC with Growth Engineering
While the product team works on LTV, the growth team's job is to find more efficient ways to bring customers in the door. This isn’t just about spending less money; it’s about spending smarter and converting more of your traffic into paying users.
1. Optimize Your Conversion Funnel
Every step in your funnel—from ad click to app download to that final subscription screen—is a point where you lose people. Growth engineering is the disciplined process of finding the biggest leaks and running experiments to plug them.
- Actionable Insight: If you see a huge 70% drop-off on your pricing page, that's your bottleneck. Start A/B testing everything: layouts, copy, CTAs, even the order of your tiers. A simple test could be highlighting a "Most Popular" plan with a colored border, which can often lift conversion by 10-15%.
2. Double Down on Organic Channels
Paid ads get you users fast, but they're expensive and disappear the moment you stop paying. Investing in organic channels like App Store Optimization (ASO) and content marketing builds a long-term, low-cost acquisition engine. For mobile apps, ASO is non-negotiable.
- Actionable Insight: Use a tool like Sensor Tower to find keywords your ideal customers are searching for. If you have a meditation app, target terms like "sleep sounds" or "anxiety relief." Weave these into your app's title, subtitle, and description to dramatically improve your App Store search ranking and lower your blended CAC.
3. Run Disciplined A/B Tests on Ad Creative
Too many teams "set and forget" their ad campaigns. A growth engineering mindset means constantly testing new creative, new copy, and new audiences to find out what actually works.
- Actionable Insight: For a social media ad campaign, create four variations: two different images (e.g., a person vs. an illustration) and two different headlines (e.g., a question vs. a statement). After a week, analyze the click-through rates (CTR) and conversion rates. Put the budget behind the winner and use the learnings to inform the next round of tests.
This methodical approach is exactly how venture-backed startups prove their business model is sound. Investors demand a ratio of 3:1 or higher for tech startups—a benchmark that has become the gold standard.
For example, a SaaS business with a $120 monthly ARPU, 80% gross margin, and a 2.5% monthly churn rate has an LTV of $3,840. That's a strong foundation for a healthy business. To dig deeper into these kinds of calculations, you can find more KPI metric analysis over at financialmodelslab.com. By focusing on these strategies, you're not just tweaking numbers; you're building a more resilient and profitable company.
LTV:CAC In The Real World: Your Questions Answered
Once you get a handle on your LTV to CAC ratio, the practical questions start bubbling up. This isn't just about spreadsheets; it's about using this metric to make faster, smarter decisions in the real world.
Let's dig into some of the most common questions I hear from founders and marketers once they move past the basic math.
How Often Should I Calculate My LTV to CAC Ratio?
The right cadence really depends on what you're using the numbers for. I like to think of it in two buckets: tactical operations and strategic planning. For most businesses, a monthly check-in is the sweet spot.
Checking monthly is frequent enough to spot trends early but not so frequent that you get lost in daily noise that might just be statistical blips. For example, if you spun up a new ad campaign on Meta at the start of the month, a monthly review gives you enough data to see if it’s actually moving the needle on your CAC.
For the bigger picture, a quarterly review is non-negotiable. This is where you zoom out and assess your entire growth strategy.
- Monthly Checks (Tactical): These are for course corrections. Is that new channel performing? Did our last app update kill churn? A monthly look helps you make quick adjustments.
- Quarterly Reviews (Strategic): This is when you ask the big questions. Should we double down on our marketing budget? Are our unit economics strong enough to expand into a new market?
Combining these two cadences gives you both the ground-level view for day-to-day management and the 30,000-foot perspective you need for long-term growth.
What Are the Biggest Mistakes People Make When Measuring LTV to CAC?
An inaccurate LTV to CAC ratio is worse than having no ratio at all. It gives you a false sense of security or, just as bad, a false sense of panic. Most errors I see come from having an incomplete picture of costs or a fundamental misunderstanding of customer behavior.
The most dangerous mistake? Misattributing costs. Too many founders only count their direct ad spend when calculating CAC. This is a fatal error. Your true CAC has to include every single dollar that goes into acquiring a customer.
The single biggest mistake is forgetting to include the salaries of your sales and marketing teams in your CAC. If you leave out the cost of the people running the campaigns, your CAC will be artificially low, and your business will look far healthier than it actually is.
Here are a few other common pitfalls to watch out for:
- Ignoring Tool Costs: That $500/month you spend on your CRM and analytics software? That belongs in your CAC.
- Using Revenue Instead of Gross Margin for LTV: LTV must be based on gross margin. This reflects the actual profit you make from a customer after you've paid for things like payment processing fees.
- Mixing New and Existing Customers: CAC is purely about the cost to acquire new customers. If you let data from returning customers bleed into your calculation, you'll completely skew your numbers.
Can My LTV to CAC Ratio Be Too High?
It sounds crazy, but yes, your ratio can absolutely be too high. A ratio of 8:1 might look fantastic on a pitch deck, but in reality, it often signals a massive, missed growth opportunity. It's a classic sign of being far too conservative with your acquisition budget.
Think of it this way: your LTV to CAC ratio is a measure of how efficiently your growth engine turns one dollar into many more. An 8:1 ratio means your engine is so efficient that you should be pouring way more fuel into it to grow much, much faster.
A ratio above 5:1 should be a trigger to aggressively increase your marketing and sales spend. If you can profitably acquire customers with that kind of efficiency, you should be capturing as much market share as you can before a competitor figures out the same channel.
For instance, if you're spending $10,000 a month on marketing to get an 8:1 ratio, you are leaving profitable growth on the table. The smart move is to systematically ramp that spend to $20,000, then $40,000, while carefully watching how the ratio responds. You might find you can spend five times more and still maintain a very healthy 4:1 ratio—and in the process, build a much larger, more valuable business.
Ready to build a mobile app with unit economics that investors will love? At Vermillion, we partner with funded startups to develop revenue-ready mobile products designed for retention and profitability. We don't just build apps; we build businesses. Learn how our performance-based model can help you scale.