Data Driven Insights Your Founder's Guide to Mobile App Growth

For a founder, your mobile app isn't just a product. It's your engine for proving traction and locking down that next round of funding.
But there's a huge difference between guessing what users want and knowing what actions will directly spike retention and revenue. This is where real data-driven insights come in. This guide is your playbook for turning raw user activity into a predictable, growing income stream.
Why Data-Driven Insights Matter for Mobile Apps
In a market this crowded, intuition is just a gamble. Data moves you from risky assumptions to evidence-based decisions, ensuring every feature you build and every dollar you spend is aimed squarely at growth. For Seed and Series A founders, this isn't a nice-to-have; it's a survival mechanism.
A data-first approach helps you answer the hard questions that define your startup's trajectory:
- Where are users really dropping off during onboarding?
- Which features correlate with the highest customer lifetime value (LTV)?
- Did that new feature actually move the needle on Day 7 retention?
Answering these requires building a system where product development is welded to measurable business outcomes like Monthly Recurring Revenue (MRR) and user retention.
A classic mistake is bolting on analytics as an afterthought. To win, you have to build a system where every feature release is a calculated experiment designed to improve a core business metric. This is how you prove ROI to investors and build a product people refuse to leave.
To get there, you need a solid foundation. We've broken down the process into four essential pillars that take you from initial setup to strategic action.
The Four Pillars of Actionable Mobile App Insights
This table outlines the core components for building a data-driven mobile product strategy, from foundational setup to advanced optimization.
| Pillar | Objective | Key Activities |
|---|---|---|
| **1. Instrumentation** | Capture clean, reliable user behavior data. | Define a tracking plan, implement event tracking (Segment, Mixpanel), ensure data quality. |
| **2. Core Metrics & KPIs** | Measure what matters for business growth. | Define and monitor key metrics like retention, LTV, MRR, and conversion rates. |
| **3. Analysis & Insights** | Uncover patterns and user motivations. | Conduct cohort analysis, build funnels, segment users to find "aha!" moments. |
| **4. Action & Experimentation** | Turn insights into measurable product improvements. | Form hypotheses, run A/B tests, and iterate on features based on results. |
Each pillar builds on the last, creating a repeatable cycle of learning and growth. This is the system that separates apps that thrive from those that merely exist.
The Opportunity for Funded Startups
The sheer scale of the mobile app economy makes a data-centric approach non-negotiable. The US mobile app development market, valued at USD 60,387.97 million in 2025, is projected to surge to USD 150,219.10 million by 2034. This explosive growth shows just how critical data insights are for turning startups into revenue powerhouses. You can explore these market trends on imarcgroup.com.
For founders racing to prove traction, this is a massive opportunity. We champion cross-platform frameworks like React Native at Vermillion because they slash time-to-market by 50% and development costs by 35%. This efficiency lets funded startups ship for both iOS and Android from a single codebase in just 10–20 weeks, getting you to the data collection and insight phase that much faster.
From Data Points to Strategic Actions
Generating insights isn't about pulling a one-time report; it's a continuous cycle. You collect the right information, analyze it to find patterns, form a hypothesis, and then act on it through experimentation.
Practical Example: Imagine a healthtech app notices that users who log their first workout within 24 hours of signing up have a 30% higher 30-day retention rate.
- Insight: The "aha!" moment is tied directly to immediate engagement.
- Actionable Insight: The product team can A/B test a new onboarding flow that actively prompts users to complete a short, introductory workout. The goal is no longer just "better onboarding"—it's to measurably improve that core retention metric by getting more users to perform that key activation event.
This playbook will walk you through building this exact system for your own app.
Building Your Data Foundation the Right Way
Killer insights don’t just happen. They’re the result of a clean, reliable, and intentional data collection strategy. For an early-stage founder, getting your instrumentation right from day one is one of the highest-leverage things you can do. It's the difference between flying blind and having a crystal-clear navigation system for your product roadmap.
So many teams fall into the trap of tracking everything, hoping they’ll find gold later. This approach just creates a noisy, unmanageable mess that engineers call "data debt." The smarter move? Start with your business goals and work backward. Define an event taxonomy that maps directly to the questions you need to answer.
This simple flow chart nails it—this foundation is what translates directly into business growth.
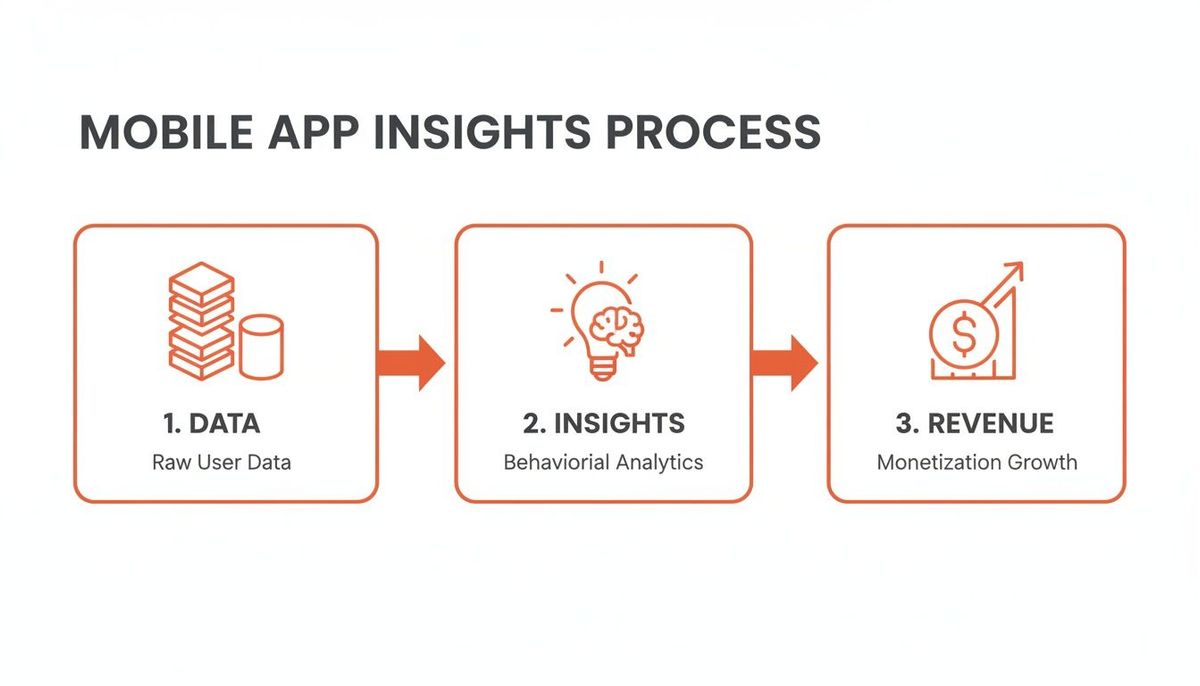
The path is obvious: high-quality raw data fuels the insights engine, which in turn drives the revenue and traction that investors want to see.
Designing Your Event Taxonomy
Think of an event taxonomy as your dictionary for user behavior. It's a structured plan defining exactly which actions you track and what properties (the contextual details) you include with each one. It's about creating a shared language for your entire team.
Start by mapping out your core user journey:
- Acquisition: How are people finding you?
- Activation: What’s the "aha!" moment where they get the value?
- Retention: What specific actions correlate with users sticking around?
Practical Example: Let's say you're a fintech app obsessed with user activation. You might track an event called OnboardingStepCompleted. That event name alone is useless, so you'd include properties like step_name, time_spent_on_step, and completed_successfully.
- Insight: By analyzing this event, you see thousands of users spending 90+ seconds on the 'ID Verification' step.
- Actionable Insight: This is a massive friction point. You can now prioritize simplifying the ID verification flow, perhaps by integrating a more efficient third-party tool, to reduce drop-offs and improve your activation rate.
Your goal isn't to track every single tap and swipe. It's to track the actions that signal intent and value creation. A well-designed taxonomy means your future self will thank you when you can easily answer questions like, "Which acquisition channel brings in users with the highest LTV?"
This disciplined approach is critical in a market that's exploding. The global app development market is projected to hit USD 305.18 billion in 2026 and skyrocket to USD 618.65 billion by 2031. This growth is being supercharged by data-driven strategies. In fact, 63% of developers are now embedding AI for personalization to improve user experience and lift MRR—a key metric for any subscription app.
For startups, this means your ability to generate clean data is directly tied to your competitive edge. You can dig into the full analysis of the app development market on Mordor Intelligence.
Choosing the Right Tools for the Job
Your analytics stack doesn't need to be complicated or expensive, but it absolutely needs to be scalable. Using the right tools for specific jobs prevents data silos and actually empowers your team to find answers.
For most React Native apps, a powerful core stack includes a Customer Data Platform (CDP), a product analytics tool, and a subscription management platform. Here’s a quick rundown of the essential tools we see work best for early-stage teams.
Essential Analytics Tools for React Native Apps
| Tool Category | Recommended Tool(s) | Primary Function |
|---|---|---|
| **Customer Data Platform (CDP)** | [Segment](https://segment.com/), [Rudderstack](https://www.rudderstack.com/) | Acts as a central hub. You instrument events once, and the CDP routes the data to all your other tools (analytics, marketing, etc.). This saves huge amounts of engineering time. |
| **Product Analytics** | [Mixpanel](https://mixpanel.com/), [Amplitude](https://amplitude.com/) | This is where you analyze user behavior. Built for creating funnels, cohorts, and retention charts to understand *why* users are doing what they're doing. |
| **Subscription & Monetization** | [RevenueCat](https://www.revenuecat.com/) | Non-negotiable for any app with subscriptions. It handles the complexity of Apple and Google billing and gives you clean data on MRR, churn, and LTV. A common, costly mistake is trying to build this yourself. |
This combination creates a seriously powerful, integrated system.
Practical Example: You can use Segment to send RevenueCat subscription events directly into Mixpanel.
- Insight: You can now build a cohort of users who started a trial from a specific TikTok campaign and see precisely how many converted to a paid plan.
- Actionable Insight: If you discover the TikTok cohort has a 20% conversion rate while the Instagram cohort only has 5%, you have clear evidence to shift your ad spend to TikTok to maximize marketing ROI. This is how you connect marketing spend directly to revenue—an absolute must for any funded startup.
If you want to go deeper on this, check out our guide on the best analytics tools for mobile apps.
Mastering the Metrics Investors Actually Care About
Let's get one thing straight: investors don't care about your download count or your daily active users. Those are vanity metrics. They want to see the engine of your business, and that engine runs on numbers that prove you have a sticky product with a clear, undeniable path to profitability.
This isn't just about tracking data; it's about generating data-driven insights that connect user behavior directly to financial outcomes. When you walk into a pitch meeting, you need to speak this language fluently. You have to show not just what your app does, but how it builds real, sustainable value over time.

Unpacking the "Big Three" Metrics
You could track dozens of data points, but your entire story to investors really boils down to three core metrics. Nail these, and you’ll have an unshakable command of your business's health.
- User Retention: This is the absolute measure of product value. It answers the one question that matters: "Are people coming back after their first experience?" High retention is the bedrock of a strong LTV and proves you're solving a real, recurring problem.
- Lifetime Value (LTV): LTV predicts the total revenue you can expect from a single customer over their entire relationship with your app. It's a direct signal of how well your monetization strategy works. A high LTV gives you the firepower to go out and confidently invest in acquiring more users.
- Monthly Recurring Revenue (MRR): For any subscription app, MRR is your lifeblood. It's the predictable, stable revenue you can count on every single month. Investors fixate on MRR because it points to a scalable and forecastable business model.
These metrics are deeply interconnected; they tell a single, cohesive story about your app's viability. Understanding how different marketing channels contribute to this story is also key, often requiring advanced techniques for proving your Marketing ROI with data-driven models.
Cohort Analysis: The Only Way to Truly Understand Retention
A cohort chart is your best friend for seeing how sticky your product really is. It groups users by when they signed up (like the "January Week 1" cohort) and shows you what percentage of them are still active over time. This is infinitely more powerful than a simple, blended retention rate.
Practical Example: Imagine you see that your March cohort has a 15% higher Day 30 retention than your February cohort.
- Insight: This isn’t just a number—it’s a breadcrumb. You dig in and realize that in early March, you shipped a slick new onboarding flow.
- Actionable Insight: This provides strong evidence that the new onboarding is working. The next step is to analyze what specific elements of that flow are driving engagement and double down on them, or even apply those learnings to other parts of the app.
A classic founder mistake is getting fooled by blended retention rates. Cohort analysis exposes the truth. It shows whether your product is actually getting better and stickier over time, a powerful signal to investors that you have a team that learns and iterates effectively.
Funnel Analysis: Finding Exactly Where Your Leaks Are
While cohort analysis shows you if users are sticking around, funnel analysis tells you why they might be leaving. It maps out a critical journey—like onboarding or making a first purchase—and reveals the conversion rate at every single step.
Practical Example: Let's use a fitness app with a free trial.
The Onboarding Funnel:
- App Open: 100%
- Account Created: 85% (a 15% drop-off)
- Onboarding Questions Completed: 60% (a 25% drop-off)
- Trial Started (Paywall): 30% (a huge 30% drop-off)
The data-driven insight here is crystal clear: the biggest leak in your bucket is the paywall, where half of the remaining users are bailing.
- Actionable Insight: This is no longer a vague problem like "improve onboarding." It's a specific, measurable issue. You can form a hypothesis: "Users aren't seeing enough value to commit to a trial." The action is obvious: run an A/B test on the paywall screen. Test adding user testimonials or highlighting a key feature, and then measure its direct impact on that trial start rate.
The potential here is enormous. The mobile app market is projected to grow from $935 billion in 2024 to $1.1 trillion by 2034, with users spending an average of 4.6 hours a day in apps. This growth is largely fueled by the kind of AI-powered personalization that boosts retention and LTV. Investors scrutinize these core metrics because they are the clearest predictors of who will capture a piece of that prize.
For founders, these numbers aren't just for pitch decks. They should guide your entire product strategy, ensuring every decision you make is aimed at building a more valuable, more sustainable business. If you're looking to get deeper into the mechanics, you might find our guide on how to properly calculate customer lifetime value useful.
Putting Your Insights Into Action with Experimentation
Insights sitting in a dashboard are just expensive data points. The real value is unlocked when you translate those findings into tangible product improvements. This is where experimentation comes in—it provides a structured, repeatable framework for turning your analysis into measurable growth.
You’re not guessing; you’re forming a hypothesis from your data and then systematically testing it. This de-risks your product roadmap and builds momentum based on evidence, not just assumptions.

From Data Insight to Testable Hypothesis
Every meaningful experiment starts with a strong, data-backed hypothesis. It connects a proposed change to an expected outcome, creating a clear "if we do X, then Y will happen" statement. Vague goals like "improve engagement" are useless here. You need to be specific.
Let's walk through a realistic scenario for a social discovery app.
The Initial Insight:
Through cohort analysis, the product team discovers a powerful correlation: users who add at least three friends during their first session have a 40% higher Day 7 retention rate. This isn't a random stat—it's a clear signal pointing to the app's "aha!" moment.
The Hypothesis:
"If we introduce a 'Friend Suggestions' screen immediately after sign-up, we will increase the number of users who add at least three friends in their first session, leading to a measurable lift in Day 7 retention."
This hypothesis is strong because it’s:
- Actionable: It proposes a specific product change (a new screen).
- Measurable: It defines clear success metrics (friends added, Day 7 retention).
- Insight-Driven: It’s born directly from an observation in the user data.
Designing and Running Your A/B Test
With a solid hypothesis, you can design an A/B test. This involves splitting your new users into two groups:
- Control (Group A): Sees the existing onboarding flow without any changes.
- Variant (Group B): Sees the new "Friend Suggestions" screen after sign-up.
The goal is to isolate the impact of this single change. Tools like Optimizely or feature flag platforms like LaunchDarkly can handle the user segmentation and tracking for you. As you scale, optimizing your user acquisition becomes even more critical; you can explore more strategies for effective user acquisition for mobile apps.
One of the most common pitfalls is ending a test too early. You might see an exciting lift after just two days and be tempted to roll it out. Don't. You need to run the test long enough to reach statistical significance, which confirms the results aren't just due to random chance. You also need to run it for a full business cycle—like a full week—to account for daily fluctuations in user behavior.
Interpreting Results and Taking Action
Once the test concludes, you analyze the results. Let's say you find that the Variant group not only added more friends but also showed a statistically significant 8% increase in Day 7 retention. This is a clear win. The data-driven insight has been validated, and the next step is to roll out the new feature to 100% of new users.
But what if the test bombs? What if the new screen had no impact on retention, or even hurt it?
This is not a failure; it’s a learning. An inconclusive or negative result is just as valuable because it prevents you from shipping a feature that doesn't work. It forces you to ask deeper questions. Maybe the design was confusing. Maybe the friend suggestions weren't relevant. This new data feeds back into the cycle, helping you form a smarter, more refined hypothesis for your next experiment.
This continuous loop of insight -> hypothesis -> experiment -> learning is the engine of a high-growth product. It transforms your team from a feature factory into a disciplined, outcome-focused organization that builds what users demonstrably want and need.
Building a Data-Driven Culture
Having the right analytics stack and a solid experimentation framework is a massive step. But tools don't create results—culture does.
To really move the needle, you have to embed a data-informed mindset into your company’s DNA. This is a real shift. It’s about moving from a culture where the loudest voice or the highest-paid person's opinion wins, to one where curiosity is the default, and every assumption gets challenged with real data.
This doesn't happen overnight. It takes a conscious, deliberate effort to make data easy to get, simple to understand, and a core part of your team's weekly rhythm. The goal is to create an environment where everyone, from the CEO down to the marketing intern, feels empowered to ask questions and use data-driven insights to help the product grow. To get this right, you need to understand what it actually means to be Data Driven.
Put the Data Where Everyone Can See It
Data locked away in complex systems is useless to most of your team. The first, most crucial step is to get it out in the open. You do this by creating simple, accessible dashboards that broadcast your most important KPIs at a glance.
Tools like Metabase or the native dashboards inside Amplitude are perfect for this. You don't need a data scientist to set them up. Your focus should be on creating a single source of truth that visualizes the "Big Three" metrics we talked about earlier:
- User Retention Cohorts: A clean, color-coded chart showing weekly or monthly user retention. No ambiguity.
- LTV by Acquisition Channel: A simple bar chart that immediately answers, "Where are our best users coming from?"
- MRR Growth: A trend line showing new, expansion, and churned MRR.
The point of a dashboard isn't just to report numbers; it's to spark questions. When a marketer sees that users from a new campaign have a 10% higher LTV, they're instantly empowered to dig deeper and double down on what works—without having to file a ticket with engineering.
Put this dashboard on a TV in the middle of the office. Make it the homepage on everyone’s browser. Constant exposure builds familiarity and keeps the entire team pointed at the metrics that actually matter.
Run Weekly Metrics Reviews That Aren't a Waste of Time
A dashboard is passive. A dedicated meeting forces active engagement. We've seen teams transform their trajectory by running a weekly "Metrics Review" meeting with a strict focus on one thing: defining the next action. This isn’t about reporting numbers; it's where your data-driven insights become real work.
Here’s a practical format that actually works:
- KPI Pulse Check (5 minutes): Glance at the main dashboard. Retention up or down? Did we hit our MRR target? This is just context-setting.
- Deep Dive (15 minutes): Each week, a different person presents a deep dive into one specific metric or a recent experiment. For example, the product manager could walk through the results of an A/B test on the paywall.
- "So What?" Discussion (10 minutes): This is the most important part. The group debates the "why" behind the numbers. Why did the new paywall design fall flat? Was the value prop unclear? Did the button color really matter?
- Define Next Actions (5 minutes): Based on the discussion, assign a clear, concrete next step to a specific person. It might be "Launch a new experiment testing different value props on the paywall" or "Interview five users who abandoned checkout."
This structure turns a boring status update into a dynamic problem-solving session. It builds accountability and creates a repeatable rhythm for turning analysis into action.
Make Curiosity the Default
Ultimately, a data-driven culture is a curious one. It's about creating enough psychological safety for anyone on the team to question the status quo and ask, "How do we know that's true?"
Practical Example: When a designer proposes a new home screen layout, instead of the team saying "That looks great!", the default response becomes "What user problem are we solving with this redesign, and what key metric do we expect to improve? How can we test this as an experiment first?"
This change starts at the top. As a founder or leader, you set the tone. By consistently grounding your own decisions in data and celebrating the learnings from both successful and failed experiments, you signal to everyone that this is how your company operates. The result is a team that moves faster, makes smarter bets, and is deeply aligned on building a product that users actually value.
Common Questions About Mobile App Analytics
Founders are always asking me how to handle analytics, especially in the early days when you're just trying to get something built and prove it works. It's a common stumbling block, but it doesn't have to be complicated.
Here are the straight answers to the questions that come up most often.
How Much Should We Really Spend On An Analytics Stack?
For a seed-stage company, your most valuable investment isn't money—it's the time you spend mapping out a clean event taxonomy from day one. Seriously. Getting this right from the start saves you from an incredibly expensive data cleanup nightmare down the road.
Forget about a massive budget. A few hundred dollars a month is all you need to get a powerful, scalable stack in place.
Here’s a practical, founder-friendly setup:
- Customer Data Platform (CDP): Start with a free or startup plan from Segment or RudderStack. This is your central nervous system for data, and it'll save your engineers countless hours.
- Product Analytics: The free tiers from Mixpanel or Amplitude are more than enough to get you started with deep funnel and cohort analysis.
- Monetization: If you're building a subscription app, RevenueCat is non-negotiable. It handles the brutal complexity of in-app purchases so you can focus on your product.
What's The One Metric That Truly Matters For A Subscription App?
MRR is the goal, but it's a lagging indicator. The metric that predicts your success is long-term cohort retention.
Strong retention is the engine that drives everything else. It's what creates a healthy Lifetime Value (LTV) and makes sustainable growth even possible. Too many founders get obsessed with acquisition, but if your users don't stick around, you're just lighting money on fire.
Get laser-focused on your Day 1, Day 7, and Day 30 retention curves. Dig into the behavior of your best cohorts—that’s where you’ll find the "aha!" moments you need to guide every new user toward.
A healthy retention curve is the single most powerful signal of product-market fit you can show an investor. It’s hard proof you’ve built something that delivers real, recurring value.
How Do We Stay Data-Driven Without Slowing Down?
This isn't an either/or situation. Being data-driven isn't about moving slower; it's about being smarter with the limited engineering resources you have. It de-risks your roadmap and stops you from wasting months building features nobody will use.
Think of it as a shift in mindset: "measure what you ship."
Practical Example:
- Big bets: Before committing months of dev time to a new "social groups" feature, create a simple waitlist landing page for it inside your app. Track a
WaitlistJoinedevent. If only 0.5% of users sign up, the data suggests this isn't a burning need, saving you from a costly mistake. - Small changes: Frame them as experiments. Ship an MVP of a new UI element behind a feature flag to a small segment of users. This lets you learn and validate your assumptions fast, without derailing your entire development velocity.
Being data-driven isn't about adding bureaucracy. It’s about building a disciplined system that reduces the risk of building the wrong thing. It ensures every precious engineering hour actually contributes to growth.
At Vermillion, we build revenue-ready mobile apps for funded startups that prove traction, retention, and ROI. Our performance-based model means we only succeed when your core business metrics do, so every feature we ship is designed to move the needle.
Learn more about how we partner with founders to turn data into revenue.